Zabbix vs Prometheus for a Homelab: SNMP Templates or Exporters and PromQL

Jesse Cole
October 15, 2026
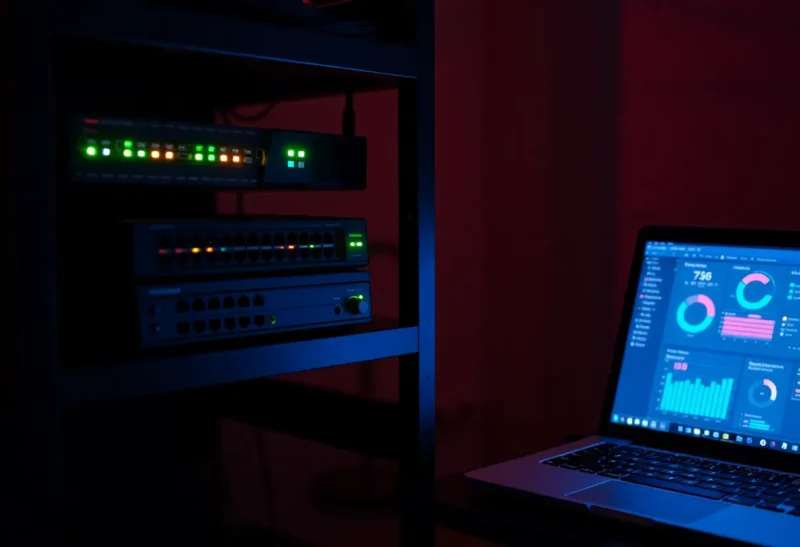
Take stock of what is actually in a typical homelab, and it is rarely just servers. There is a managed switch or two, a router, a UPS under the desk, a NAS, a printer, a couple of access points, and then the machines running containers. When people set out to monitor all of it, they usually reach for Prometheus, because that is what every container tutorial uses. Then they try to monitor the switch and the UPS, and discover that half the homelab speaks a completely different language.
That language is SNMP, the protocol network gear has used for decades to report its status, and it is where Zabbix comes in. Zabbix and Prometheus are both mature, open-source monitoring systems. They were built for different worlds, and a homelab sits right between them. I have run both, at work as an SRE and at home, and the choice gets much easier once you list what you actually want to watch.
Two traditions of monitoring
Zabbix comes from traditional IT monitoring: networks, servers and devices in offices and data centres. It runs a central server with a SQL database and a web interface. It collects data through its own agents on servers, through SNMP from network equipment, and through many other methods. Its standout features are templates, ready-made monitoring definitions for common devices and operating systems, and discovery, which can scan your network and start monitoring what it finds. Alerts, escalation and maps are all built in, configured through the web interface.
Prometheus comes from the cloud-native world of containers and microservices. It scrapes metrics from small programs called exporters, stores them in its own time-series database, and answers questions in a query language, PromQL. It is usually paired with Grafana for dashboards and Alertmanager for notifications. Configuration lives in text files, which suits people who keep their homelab in a Git repository.
| Zabbix | Prometheus | |
|---|---|---|
| Built for | Networks, servers, devices | Containers, services, application metrics |
| Collection | Agents, SNMP, many other methods | Exporters, scraped over HTTP |
| Network gear (SNMP) | Excellent, with ready-made templates | Possible through the SNMP exporter, with more setup |
| Discovery | Network and low-level discovery built in | Service discovery for containers and cloud; less for devices |
| Configuration | Web interface | Text files |
| Storage | SQL database | Built-in time-series database |
| Dashboards | Built in; Grafana optional | Grafana, in practice |
| Alerting | Triggers and actions, built in | Rules plus Alertmanager |
Monitoring the network gear
This is the clearest difference. Managed switches, routers, UPS units, printers and many NAS boxes expose their status over SNMP: port traffic and errors, battery charge and runtime, toner levels, temperatures, fan speeds. Zabbix is built for this. You add a device, apply a template for its type, and within minutes you have graphs for every switch port and alerts for a UPS on battery. Zabbix’s network discovery can even scan a subnet and add devices automatically.
Prometheus can do it too, using the official SNMP exporter. But SNMP data is described by MIB files, and the exporter needs a configuration generated from those MIBs for each device type. For common hardware there are ready-made configurations; for anything unusual you will be generating your own. It works, and once set up it is solid, but it is a project rather than a few clicks.
If your homelab includes a managed switch you care about, a UPS you want to watch, or several access points, this difference alone may decide it. Networking gear is increasingly part of home setups, and a controller-managed system, as in UniFi or Omada, has its own dashboards, but a separate monitoring system still helps you see long-term trends and get alerts in one place.
Monitoring containers and services
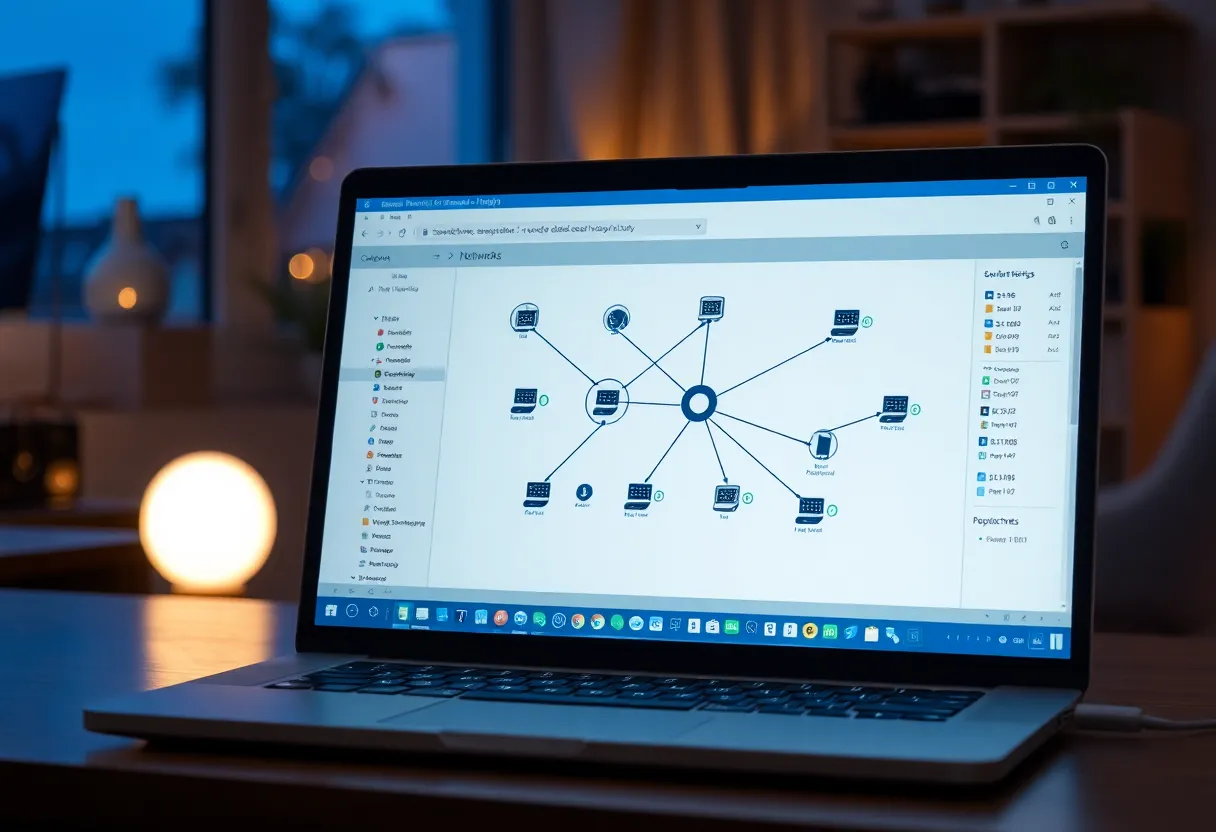
Here the balance flips. Prometheus is at home with Docker and the software that runs in it. cAdvisor or the Docker daemon itself can expose container metrics, and a huge number of self-hosted applications either expose Prometheus metrics natively or have a ready-made exporter: databases, reverse proxies, media servers, home automation and more. Service discovery can find containers automatically as they come and go. If you write your own small services, adding Prometheus metrics to them is standard practice in almost every language.
Zabbix can monitor Docker as well, through its agent and templates, and it does a respectable job of container counts, states and resource use. But application-level metrics, the internals of each service, are where Prometheus’s ecosystem is far larger.
Configuration: web interface or text files
Zabbix is configured almost entirely through its web interface: hosts, templates, triggers, actions, users. That is approachable, and it means you can see and change everything in one place. The downside is that your monitoring configuration lives in a database, not in files you can read, review and keep in Git. Zabbix does support exporting and importing configuration, but it is not how most people work with it day to day.
Prometheus is the opposite: scrape targets, alert rules and Alertmanager routing are YAML files. That suits a homelab managed with Docker Compose files and a Git repository, where you can rebuild everything from scratch. The cost is that there is no friendly interface for adding a target or changing a threshold; you edit a file and reload.
Neither approach is better in general. It depends on whether your homelab is something you click around in or something you rebuild from a repository.
Alerts
Both are good at alerting, in different styles. Zabbix triggers are conditions on collected data, such as “UPS on battery” or “disk over 90% full”, with built-in severity levels, dependencies (do not alert about every device behind a switch when the switch itself is down) and escalation. Templates come with sensible triggers already defined, so you get useful alerts on day one.
Prometheus alert rules are written in PromQL and are especially good at rates and predictions, such as “this disk will be full in four hours at the current rate”. Alertmanager then groups, silences and routes them. You write most rules yourself, though community rule collections help. How Alertmanager compares with Grafana’s own alerting is a separate decision, covered in Grafana Alerting vs Prometheus Alertmanager.
Resources and maintenance
Zabbix needs a server process, a database (PostgreSQL or MySQL/MariaDB), and a web front end. The official Docker images make that a short Compose file, and it runs comfortably on a small home server for a few dozen devices. Its database grows with history, and Zabbix’s housekeeping settings control how long detailed data and trends are kept. Upgrades between major versions include database migrations, so back up first.
Prometheus is a single binary with its own storage, plus exporters and usually Grafana and Alertmanager. It is light at homelab scale. Retention defaults to fifteen days and can be raised; for long history on small hardware, pairing it with a more efficient store is an option, as covered in Prometheus vs VictoriaMetrics.
Both need monitoring of their own: if the box running them dies, nothing alerts you. Keep at least one outside check, such as a simple uptime monitor on another machine or a hosted service, pointed at your monitoring server.
Learning curve
Zabbix has many concepts, including hosts, items, triggers, templates, actions, macros and discovery rules, and its interface reflects years of enterprise features. The first week can feel heavy. But because templates do so much, you get useful monitoring before you understand all of it.
Prometheus has fewer concepts but asks you to learn PromQL to get much out of it, and to assemble the pieces yourself. If you already know it from work, it will feel natural. If you are new to both, expect to spend time either way; the question is which skills you would rather build. If even that sounds like more than you need for one machine, an all-in-one tool may suit you better, which is the trade-off in Netdata vs Prometheus and Grafana.
Running both
Plenty of homelabs end up with both, and that is not a failure of decision-making. A common split is Zabbix for the network layer, with switches, router, UPS, printer and access points watched over SNMP with ready-made templates, and Prometheus for the container layer, with services, applications and anything with an exporter. Grafana can read from both, so dashboards can still live in one place.
The cost is two systems to update and back up. If that feels like too much, pick based on where most of your important things live.
What to install first
If the things you most need to watch are devices, including switches, a UPS, a NAS, a router and printers, start with Zabbix. Its SNMP templates and discovery will give you meaningful monitoring of your whole network within an evening, with alerts that already know what a battery-powered UPS or a failing switch port looks like.
If the things you most need to watch are containers and the services inside them, and you keep your setup in configuration files, start with Prometheus. Its exporters cover almost every self-hosted application, and PromQL lets you ask precise questions about how your services behave over time.
And if your homelab has grown into both, a network worth watching and a stack of services worth understanding, there is no shame in running each tool where it is strongest. Monitoring exists to tell you about problems before they find you; the best setup is the one you will actually keep running.