Prometheus vs VictoriaMetrics for a Homelab: Disk, RAM and Long Retention on Small Hardware

Jonah Reeves
October 14, 2026
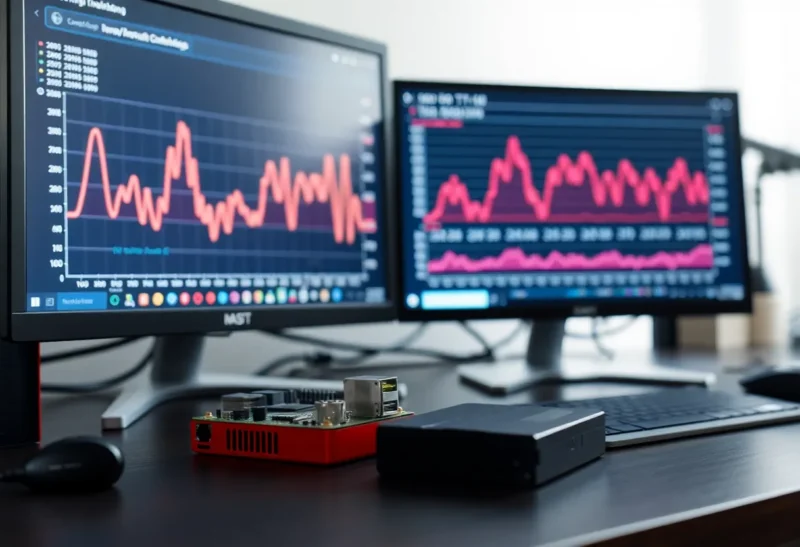
Most homelab metrics setups start the same way: Prometheus scraping node_exporter and cAdvisor, Grafana drawing the charts, and a default retention of fifteen days. That works until you want to answer a slower question. Has this disk been filling faster since spring? Did memory use creep up after last month’s update? Is the server running hotter than it did last winter? Fifteen days of history cannot tell you, and turning retention up on a small machine makes you watch the disk instead of the metrics.
VictoriaMetrics is the usual answer people find. It is a time-series database that speaks Prometheus’s language, accepts the same data, works with the same Grafana dashboards, and is known for using far less memory and disk for the same metrics. The question is whether that matters at homelab scale, and whether switching is worth it.
I spent eight years in operations at a small managed-services provider, where both ran in production. At home I have run Prometheus on its own, VictoriaMetrics on its own, and a mix. Here is where each makes sense.
If you keep a few weeks of history on a machine with a reasonable amount of RAM and disk, stay with Prometheus. It is the standard, it is simple, and at homelab scale it runs fine.
If you want months or years of history, run on small hardware such as a Raspberry Pi or a low-power mini PC, or want to store metrics from several machines in one place cheaply, use VictoriaMetrics. It does the same job with noticeably less memory and disk, and your dashboards keep working.
The standard and its leaner twin
Prometheus is the open-source monitoring system that defined the space. It scrapes metrics from exporters on a schedule, stores them in its own local time-series database, evaluates alert rules, and answers queries in PromQL. Grafana’s Prometheus data source is the default for almost every homelab dashboard you will find. Prometheus 3, released in late 2024, brought a new web interface and many improvements, but the basic model is the same as it has always been.
VictoriaMetrics is an open-source time-series database built to be compatible with Prometheus. The single-node version is one binary or container. It can scrape targets using standard Prometheus scrape configs, or receive data from Prometheus or from its own lightweight agent, vmagent, through remote write. It answers PromQL queries, plus an extended dialect called MetricsQL, so Grafana can point at it as if it were Prometheus. Alerting is handled by a separate component, vmalert, which evaluates rules and sends alerts to the same Alertmanager you already use.
| Prometheus | VictoriaMetrics (single node) | |
|---|---|---|
| Role | Scraper, database and rule engine in one | Database that can also scrape |
| Query language | PromQL | PromQL plus MetricsQL extensions |
| Grafana | Native data source | Works through the Prometheus data source |
| Default retention | 15 days | 1 month; set as you like |
| Memory and disk | Fine for weeks of homelab data | Typically much lower for the same data |
| Alerting | Built in, with Alertmanager | vmalert, with Alertmanager |
| Ecosystem and docs | The standard; everything assumes it | Good, smaller community |
What “homelab scale” actually means
Before choosing on efficiency, it is worth knowing how much data you have. A single home server running node_exporter and cAdvisor with a dozen containers produces a few thousand active time series. Add a few more exporters, for the router, UPS, a database and a smart plug or two, and you might reach ten or twenty thousand. Scrape every 15–30 seconds, and that is a small workload by any database’s standards.
At that size, Prometheus with default settings uses a modest amount of memory and a few gigabytes of disk for its fifteen days. Nothing about it is a problem. The differences start to matter in three situations: when you want much longer retention, when the hardware is small, or when one database collects metrics from several machines.
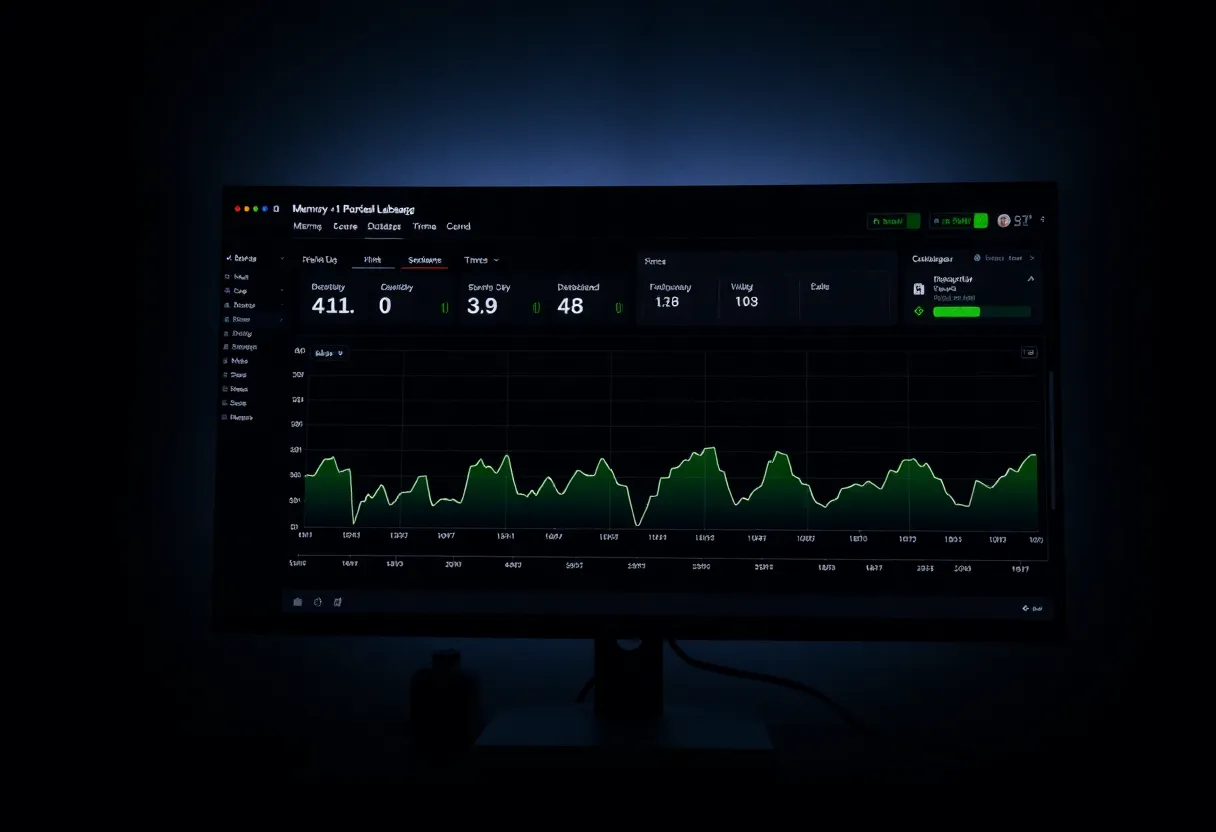
Long retention: where VictoriaMetrics pulls ahead
Prometheus can keep data for a year; you just raise the retention setting. But disk use grows in proportion, and very long retention on a single Prometheus instance is not what it was designed around. Many teams pair Prometheus with a separate long-term store for exactly this reason.
VictoriaMetrics was built with long retention in mind. Its storage format compresses time-series data aggressively, and in most comparisons it uses several times less disk than Prometheus for the same metrics. Memory use is also typically lower, especially as the number of series grows. In practice, that means a year or more of homelab metrics fits comfortably on a modest SSD, and the database stays responsive while it does.
Your mileage will vary with your data, so do not plan around a specific ratio. Run it for a week next to your existing setup and compare the numbers on your own metrics.
Small hardware
On a Raspberry Pi or a low-power mini PC that also runs your containers, every hundred megabytes of RAM counts. VictoriaMetrics’ lower memory use and efficient writes are a real advantage here, and its lighter disk writes are kinder to SD cards and cheap SSDs. Prometheus runs on a Pi too, and many people use it happily that way, but if the board is already busy, VictoriaMetrics leaves more room for everything else.
Compatibility: what keeps working
Switching is easier than it sounds because so much stays the same:
- Exporters do not change. node_exporter, cAdvisor and the rest expose the same metrics regardless of what collects them.
- Scrape configs carry over. VictoriaMetrics and vmagent read standard Prometheus scrape configuration.
- Grafana dashboards keep working. You add VictoriaMetrics as a Prometheus-type data source, and community dashboards built for Prometheus generally work as they are.
- Alert rules written in PromQL run in vmalert, which sends alerts to your existing Alertmanager.
The differences are mostly at the edges: some PromQL behaviours differ slightly in corner cases, and MetricsQL adds functions that will not work if you ever move back. The Prometheus web interface and its documentation are also what most tutorials assume, so you lean a little more on VictoriaMetrics’ own documentation.
Three ways to set it up
1. Prometheus only. The default. Keep retention at a few weeks to a couple of months, and accept that long-term questions are out of reach. Ideal if your monitoring is mainly for alerts and recent troubleshooting.
2. Prometheus plus VictoriaMetrics for long-term storage. Keep Prometheus exactly as it is, with short retention, and add a remote_write section that sends a copy of every sample to VictoriaMetrics. Grafana queries Prometheus for recent data and VictoriaMetrics for history, or VictoriaMetrics for everything. This is the gentlest path: nothing breaks, and you gain history from the day you turn it on.
3. VictoriaMetrics only. Replace Prometheus with VictoriaMetrics, scraping directly or through vmagent, with vmalert for rules. This is the leanest setup, with one database, less memory and long retention. It is a clean choice for a new homelab, or for small hardware.
Whichever you pick, keep the monitoring for the server’s own availability somewhere else. A database on the box it watches cannot tell you that the box is down, which is why at least one check should live on a different machine than the service it watches.
Backing up a year of metrics
Long retention raises a question that short retention never does: what happens to that history if the disk dies? Fifteen days of metrics is easy to lose and rebuild. A year of them is not.
Prometheus can create a consistent snapshot of its database through its admin API, which you have to enable explicitly, or you can stop it and copy the data directory. VictoriaMetrics also supports instant snapshots, and ships a dedicated tool, vmbackup, that copies snapshots to local disk or object storage incrementally, so later backups only send what changed.
Either way, treat metrics like any other data you would miss: back them up to a different disk or off the machine, and test that a restore actually starts and shows your old charts. It is also worth deciding up front how much history you really need. A year is plenty for spotting seasonal trends and slow creep; ten years of per-minute container metrics is a backup burden for very little benefit.
Do you need either?
It is worth asking whether you need a Prometheus-style stack at all. On a single home server, an all-in-one tool like Netdata gives you per-second charts and alerts with almost no setup, at the cost of shorter, less flexible history. If you are not yet committed to Grafana dashboards and PromQL, Netdata vs Prometheus and Grafana is the earlier decision. The Prometheus-or-VictoriaMetrics question only arises once you have chosen the Prometheus way of doing things.
Weeks of history or years of it
Stay with Prometheus if:
- A few weeks to a couple of months of history is enough.
- Your server has spare RAM and disk.
- You want the most standard setup, with every tutorial and dashboard working without adjustment.
- You use Prometheus at work and want the same tool at home.
Switch to VictoriaMetrics if:
- You want a year or more of history without a large disk.
- You run on a Raspberry Pi or a busy low-power mini PC.
- You collect metrics from several machines into one store.
- You want long-term storage behind an existing Prometheus, without changing anything else.
The nice thing about this choice is that it is reversible and incremental. Add VictoriaMetrics as a remote-write target next to your existing Prometheus, watch how much disk and memory it uses for a few weeks, and decide with your own numbers. Either way, your exporters, dashboards and alerts come along unchanged.