Dozzle vs Grafana Loki for Docker Logs on One Home Server: Live Tail or Searchable History

Ivo Markham
October 14, 2026
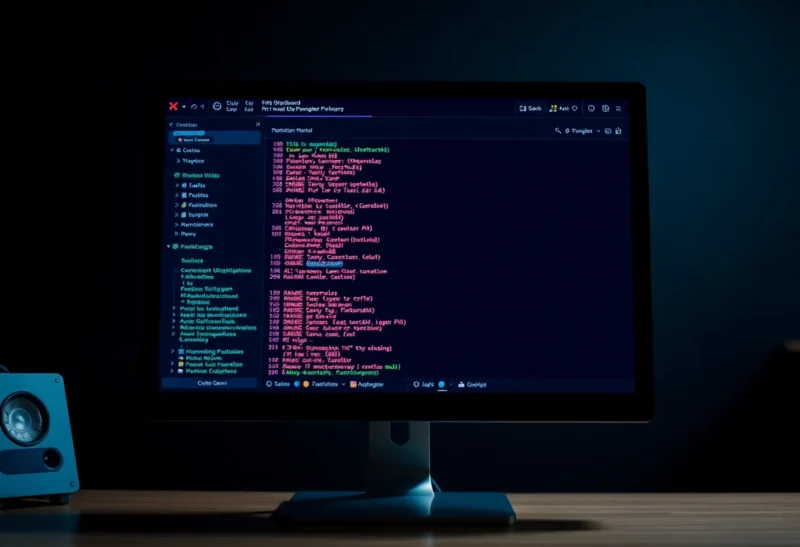
When something breaks on a home server, the first question is almost always the same: what did the container say? For a long time my answer was docker logs -f in an SSH session, scrolling back through a wall of text and hoping the error had not already rotated away. It works, but it is a terrible way to answer “what happened at 3 a.m.?” or “how often has this happened this week?”
There are two popular ways to do better on a homelab. Dozzle is a tiny web app that shows live container logs in a browser, with almost no setup. Grafana Loki is a proper log aggregation system that stores logs, indexes them, and lets you search history and build alerts. They solve different problems, and on one home server the question is how many of those problems you actually have.
I run Compose stacks for a one-person business and a basement lab, and I have used both. Here is how to choose.
Live tail now, searchable history later
If you want to see what your containers are saying right now, from a browser, in five minutes, use Dozzle. It covers most homelab log needs.
If you need weeks of searchable history, logs that survive container restarts and rebuilds, or alerts on error patterns, use Grafana Loki. It is more to run, but it answers questions Dozzle cannot.
A log viewer and a log database
Dozzle is a lightweight, open-source log viewer. You run it as a single container with access to the Docker socket, open its web page, and see every container’s logs streaming live. You can search and filter, split the view to watch several containers side by side, and jump between hosts if you run its agent on other machines. Dozzle does not store anything. It reads what Docker already keeps and shows it to you.
Grafana Loki is a log storage and query system from Grafana Labs, built on the same ideas as Prometheus. A collector ships logs from your containers to Loki, Loki stores them compressed on disk, and you query them in Grafana with a query language called LogQL. Loki indexes labels, such as container name, service and host, rather than every word, which keeps it cheap to run. Searching log text still works; it is just slower than searching labels.
| Dozzle | Grafana Loki | |
|---|---|---|
| Purpose | Live log viewing | Log storage, search and alerting |
| Setup | One container | Loki, a log collector and Grafana |
| Stores logs | No; shows Docker’s own logs | Yes, with configurable retention |
| History | Whatever Docker still has | As long as you keep it |
| Survives container recreation | No | Yes |
| Search | Filter the current logs | Query across time, containers and hosts |
| Alerts on log patterns | No | Yes, through Grafana or Loki rules |
| Resource use | Tiny | Moderate |
Dozzle: the five-minute upgrade over docker logs
Dozzle’s appeal is how little it asks. Add one service to a Compose file, mount the Docker socket read-only, and open the page. Every container appears in a sidebar, and clicking one starts a live stream of its logs. You can search within the logs, highlight matches, filter by level, and open several containers in a split view, which is useful when a web app and its database are failing together.
It also handles a few things that make life easier day to day: JSON logs are formatted nicely, container stats such as CPU and memory appear next to the logs, and with the agent installed on other machines you can view logs from several hosts in one place. It can optionally restart or stop containers from the interface, which is convenient but worth leaving off if you share access.
The limitation is fundamental to its design: Dozzle shows what Docker has. Docker keeps logs for a container until that container is removed. When you run docker compose up with a new image and the container is recreated, the old logs go with it. If the problem happened before the last update, Dozzle cannot show it. And on a server where containers are recreated often, history is short.
Loki: when history and search matter
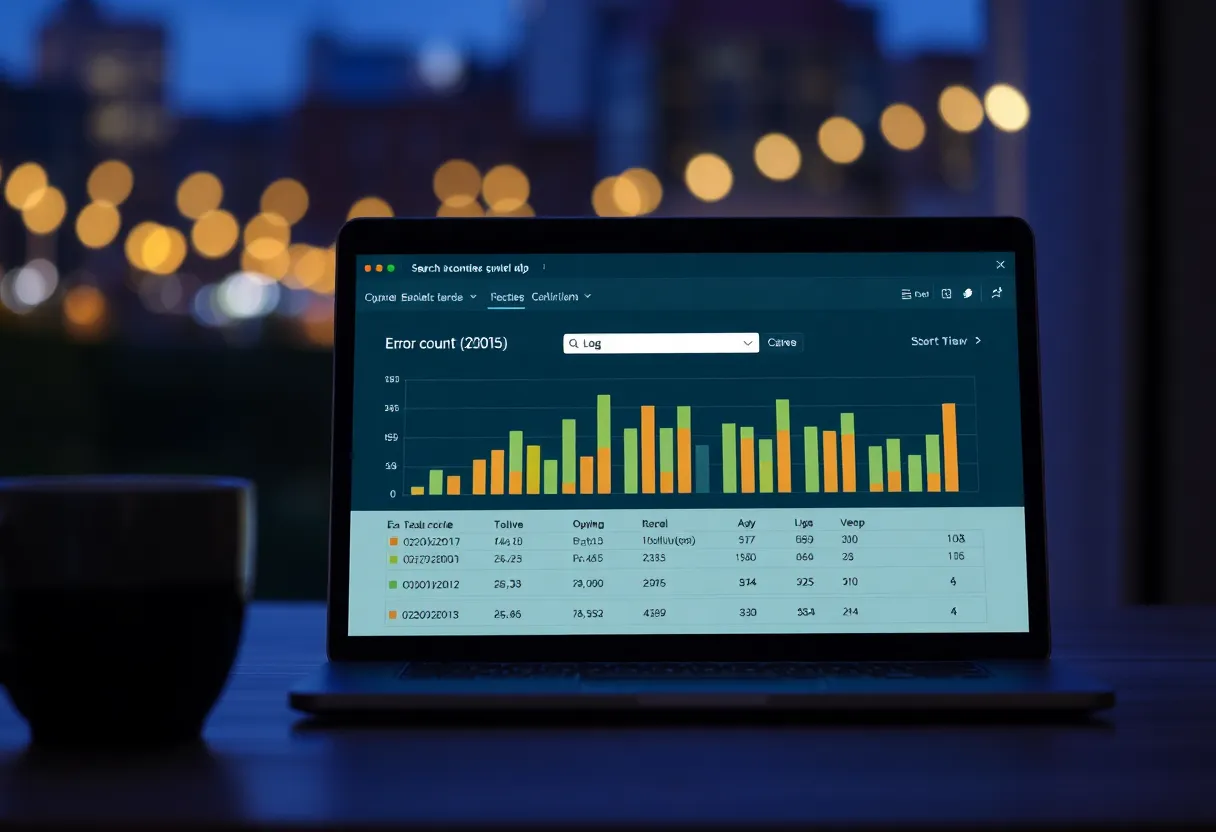
Loki solves the history problem. Logs are shipped as they are written and stored independently of Docker, so recreating a container, rebooting the host or updating an image does not lose anything. You choose how long to keep logs, for example 30 days, and Loki deletes older data automatically.
Querying is the other big difference. In Grafana you can ask questions that are impossible in a live viewer:
- Show every error from any container in the last 7 days.
- Show the reverse proxy’s logs for requests that returned a 502, and plot how many there were per hour.
- Show what the database logged in the five minutes before the app crashed last Tuesday.
- Compare error counts this week with last week.
Loki can also drive alerts. Rules can fire when a log pattern appears too often, for example when a backup container logs “failed”, or authentication errors spike. That turns logs into an early warning system, not just a debugging tool.
The cost is setup and resources. A typical homelab Loki stack has three parts: Loki itself, a collector that reads container logs and sends them to Loki, and Grafana to query and display them. For collection, Grafana’s own agent, Alloy, has become the recommended choice, replacing the older Promtail, though both work. There is also a Docker logging driver plugin that sends logs straight to Loki. You will spend an afternoon getting labels, retention and a first dashboard right.
If you already run Grafana for metrics, Loki is a natural addition: logs and metrics sit side by side, and you can jump from a CPU spike to the logs from the same minute. If you are still deciding whether you need Grafana at all, Netdata vs Prometheus and Grafana covers the metrics side of the same decision.
A trap both share: Docker’s default logging
By default, Docker’s json-file logging driver does not limit log size. A chatty container can write gigabytes of logs over months and quietly fill the disk. I have had a server stop working because a misbehaving container’s log file grew until there was no space left.
Fix this whichever tool you use. Set log rotation globally in Docker’s daemon.json, for example a maximum size of 10–50 MB per file and three files per container, or per service in your Compose files. With Dozzle, this also defines how much history you can see, so choose the limit deliberately. With Loki, rotation on the host does not matter for history, because logs have already been shipped, but you still need it to protect the disk.
Security: both can see everything
Logs contain more than people expect: internal hostnames, email addresses, request paths, sometimes tokens that an app should not have logged. Dozzle needs access to the Docker socket, which is effectively root on the host. Mount it read-only, turn on Dozzle’s authentication, and never expose it directly to the internet. Put it behind a reverse proxy with authentication, or reach it over a VPN.
Loki’s data sits in Grafana, which has its own users and permissions, but the same rule applies: Grafana with access to your logs should not be on an open port. And if you would not want a log line read by a stranger, fix the app that writes it rather than relying on the log viewer to hide it.
Running both
Many homelabs end up with both, and they do not conflict. Dozzle is the quick look: open a browser tab and see what a container is doing right now, with no queries to write. Loki is the archive and the alarm: searchable history for the incidents you investigate later, and alerts for the patterns you care about.
A sensible path:
- Start with Dozzle and set Docker log rotation. That alone fixes most daily frustration.
- Add Loki when you first lose logs you needed: a problem you could not investigate because the container had been recreated, or because the error happened days ago.
- Add a few log alerts once Loki is in place, for backup failures, repeated crashes, and authentication errors. Pair them with container healthchecks, since a container that logs nothing at all can also be broken, which is why Docker Compose healthchecks that test readiness matter as much as logs.
Dozzle first, Loki when you lose a log you needed
Dozzle covers it when:
- You want to see live container logs in a browser instead of over SSH.
- You mainly debug problems as they happen.
- You want something that takes five minutes and almost no resources.
Loki is worth the setup when:
- You need logs that survive container updates and recreation.
- You investigate problems after the fact and need to search across days or weeks.
- You want alerts on log patterns, or already run Grafana for metrics.
On a single home server, Dozzle plus sensible log rotation is enough for most people most of the time. Loki earns its setup the first time you need to answer “what happened last Tuesday?” and realise that, without it, nobody can.