Shelly Plug vs Tapo P110 for Measuring Homelab Power Use: Local API or Cloud App

Evan Pierce
October 15, 2026
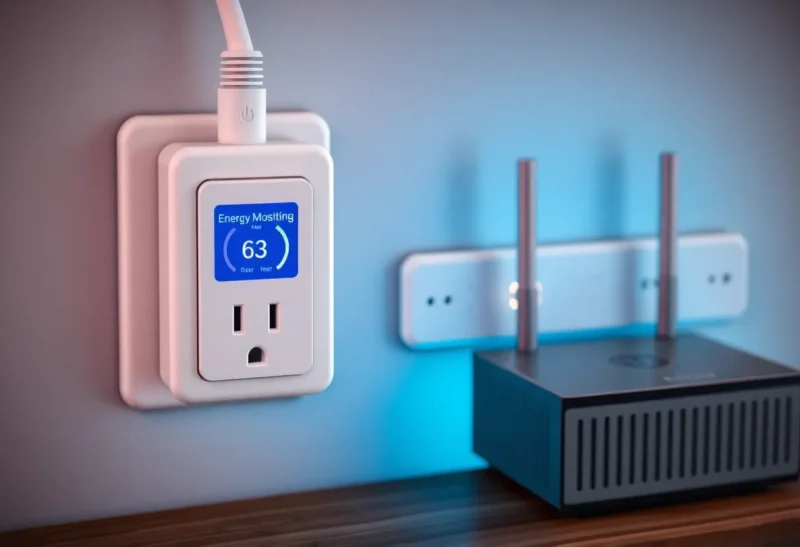
Every homelab eventually gets the same question: how much is this actually costing me? Spec sheets and online calculators only get you so far. The honest answer comes from measuring the real draw at the wall, over days and weeks, while your server, NAS, switch and router do what they normally do. The cheapest way to do that is a smart plug with energy monitoring, and two of the most common choices are a Shelly plug and the TP-Link Tapo P110.
Both measure power, both cost little, and both show a neat graph in an app. The difference that matters for a homelab is where the data lives and how easily you can get it out. I measure my own rack this way and have used both brands on the same equipment, so here is how they compare for this specific job.
What you are really buying: a meter with a relay
For homelab measurement, the switching part of a smart plug is almost a side feature. You rarely want to cut power to a server remotely, and doing it by accident is a good way to corrupt a disk. What you are really buying is a small energy meter that reports watts, accumulated kilowatt-hours, and often voltage and current.
That shifts the priorities. Accuracy at the loads you care about, reliability of reporting, local access to the readings, and the ability to store history for months matter far more than app polish or voice assistant support.
| Shelly plug (Plus / Gen3 range) | Tapo P110 | |
|---|---|---|
| Energy monitoring | Watts, energy, voltage, current | Watts and energy, with history in the app |
| Local API | Yes, documented HTTP and RPC API | Not officially documented; community libraries |
| MQTT | Built in | No |
| Works without the cloud | Yes, fully | Partly; setup and the app rely on TP-Link’s cloud |
| Home Assistant | Official local integration | Official TP-Link integration, local with account credentials |
| Typical price | Somewhat higher | Very low, often sold in multi-packs |
Exact models, plug types and rated loads differ by region, so check the version sold in your country, especially if you plan to measure anything heavier than a server, like a space heater or a rack with many drives spinning up at once.
The Tapo P110: cheap and easy, with the data in the cloud app
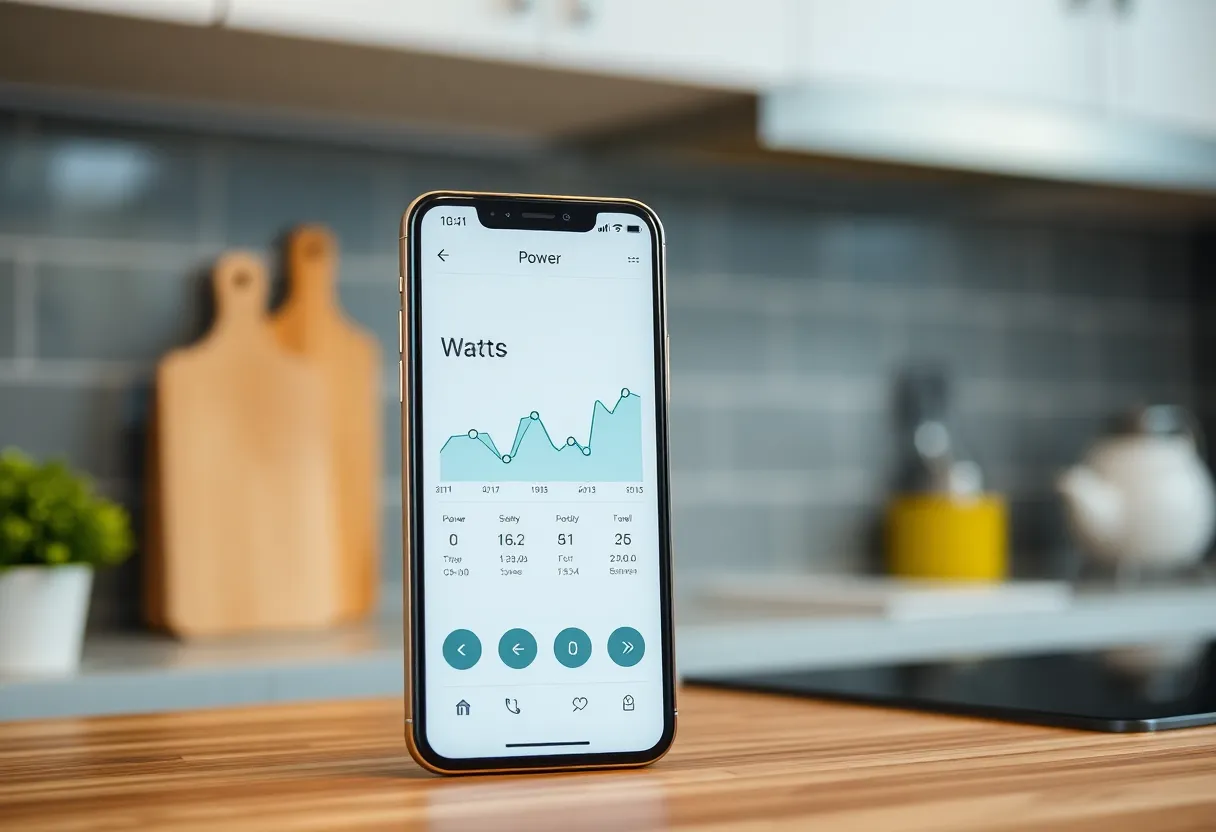
The Tapo P110 is popular for good reasons. It is inexpensive, compact, easy to set up, and the Tapo app shows current power, daily and monthly energy use and estimated cost with almost no effort. For a quick answer to “what does my NAS draw?”, plug it in, wait a day and read the app.
The catch for homelab use is access. Setup requires a TP-Link account and the app, and the app is the main way to view history. There is no official, documented local API for the P110. Home Assistant’s TP-Link integration and community libraries can read Tapo plugs over your local network, using your TP-Link account credentials to authenticate, and this works well for many people.
However, TP-Link has changed the authentication method in firmware updates before, which temporarily broke local access for community tools until they were updated. That is not a disaster, and it has been resolved each time, but it is a risk you carry when your monitoring depends on reverse-engineered access to a device made primarily for an app.
Shelly: built to be talked to locally
Shelly’s devices are designed around local control. Each plug runs a small web server with its own settings page, exposes a documented HTTP and RPC API, can publish readings over MQTT to your own broker, and works with no cloud account at all. The Shelly cloud and app are optional extras for those who want them.
For a homelab, that is a big advantage. You can poll the plug from a script, scrape it into Prometheus, send its readings to InfluxDB through MQTT, or add it to Home Assistant with the official local integration, all without depending on a company’s servers. If you block the plug’s internet access at the firewall, it keeps working and reporting.
Shelly plugs usually cost somewhat more than Tapo plugs, and model names change with each generation (Plus, Gen3 and so on), which can make shopping confusing. But the core design, local API first, has been consistent.
Accuracy where homelab loads actually sit
Homelab equipment spends most of its time at modest loads. A mini PC idles around 5–15 W, a small NAS with spinning drives might sit at 20–40 W, a switch 5–20 W, and a full rack with a server and drives can reach 100–200 W. Plug-in meters in this price range are generally reasonable from tens of watts upward. At very low loads, a few watts, readings can be less precise, and differences of a watt or two between brands are normal.
For deciding whether a device is worth keeping on 24/7, that precision is plenty. The difference between a 12 W mini PC and a 60 W old server is obvious on either plug. If you need lab-grade accuracy, a dedicated power meter is the right tool, but for monthly cost estimates, both plugs are good enough.
A practical tip: measure for at least a week. Backups, scrubs, updates and media transcodes cause spikes, and averages over a few minutes can mislead badly. The energy counter over days is what turns into your electricity bill.
Turning readings into a power budget
Once you have real numbers, the useful work begins. Multiply the average watts by 24 hours and 365 days, divide by 1,000, and multiply by your electricity price per kilowatt-hour. A 30 W average costs about 263 kWh a year, which at 30 cents per kWh is roughly 79 a year in your currency. A full breakdown of what that means for an always-on machine is in the real cost of running a personal server 24/7.
Measurement often changes decisions. People find that an old enterprise server costs more per year in electricity than a new mini PC would cost outright, or that a NAS spends most of its power spinning drives that are rarely accessed. If you are experimenting with local AI, measure the GPU machine under load too, because the numbers can surprise you, as described in how much electricity running a local LLM uses.
Graphs that last longer than an app’s history
The Tapo app keeps history, but on TP-Link’s terms: daily and monthly summaries, viewable in the app. If you want to compare this winter with last winter, overlay power with CPU load, or alert when a device’s draw changes unexpectedly, you need the data in your own system.
With Shelly, that is straightforward: Home Assistant’s energy dashboard, Prometheus with an exporter, or MQTT into InfluxDB and Grafana all work locally and have been documented many times by the community. With Tapo, Home Assistant is the most practical route, and it works, with the caveat about firmware changes above.
A change in power draw is also a useful health signal. A NAS that suddenly draws 10 W more may have a drive that stopped spinning down, and a server whose idle power creeps upward may have a process stuck at full CPU. Simple alerts on power readings catch problems that other monitoring misses.
Plugs, UPSes and where to measure
If your equipment sits behind a UPS, you have a choice: measure each device separately or measure the whole UPS input. Measuring the UPS input captures everything, including the UPS’s own losses and battery charging, which is the real cost. Measuring devices separately tells you which one to replace. Many people do both: one plug at the wall feeding the UPS and a couple more on the biggest consumers.
Some UPS units report their own load over USB or a network card, which can replace a smart plug for the total. Choosing the right UPS for a NAS is its own topic, covered in UPS pure sine vs simulated sine for a NAS.
Two cautions: never put a smart plug between a UPS and a device where an accidental “off” could crash a running server, or at least disable remote switching on that plug if possible; and stay within each plug’s rated load, especially with anything that has a large startup surge.
A week of numbers for the price of a plug
If you just want to know what your NAS or mini PC costs to run, and you are happy to read the answer in a phone app, the Tapo P110 is cheap, easy and accurate enough. Buy a multi-pack, measure everything for a week, and you will learn a lot.
If you want power data as part of your homelab, graphed in Grafana, stored in your own database, alerting through Home Assistant, and working even when the internet or the manufacturer’s cloud is down, buy Shelly. The local API and MQTT support are exactly what a homelab needs, and they are official, not reverse-engineered.
Either way, measuring is better than guessing. The first week of real numbers usually pays for the plugs by showing you which device to replace or switch off.