Why the Most Accurate Weather Forecasts Are Harder to Access Than They Should Be

Elena Vasquez
July 7, 2026
Most people check the weather through a phone app or a website that presents a simple, confident forecast: partly cloudy, 18°C, 30% chance of rain. What they’re seeing is a consumer presentation layer built on top of numerical weather prediction (NWP) models that are far more complex and information-rich than the final output shows. The translation from probabilistic model output to the clean consumer interface discards a significant amount of the most useful information—and accessing that underlying information is more difficult than it should be.
The reason this matters is that weather prediction is better than most people realise, the information in the underlying models is genuinely more useful than what consumer apps show, and the barriers to accessing it are more structural than technical. Understanding what’s available and how to use it changes how you interact with weather forecasts for decisions that depend on them.
How Modern Weather Forecasting Actually Works
Modern numerical weather prediction uses global atmospheric models that divide the atmosphere into a three-dimensional grid, apply the equations of atmospheric dynamics and thermodynamics, and step the simulation forward in time. The major operational models include the European Centre for Medium-Range Weather Forecasts (ECMWF) IFS model, the US Global Forecast System (GFS), the UK Met Office’s Unified Model, and a growing number of high-resolution regional models.
These models run as ensembles—not a single deterministic forecast, but an ensemble of typically 50–100 slightly different runs, each starting from a slightly perturbed initial state. The spread between ensemble members provides a direct measure of forecast uncertainty: if all 50 members agree on tomorrow’s weather, you have a high-confidence forecast. If they diverge substantially, the forecast is genuinely uncertain—and any confidence expressed in a single-number consumer forecast for that day is misleading.
The ECMWF ensemble (known as ENS) runs 51 members at 9km horizontal resolution out to 15 days, plus high-resolution deterministic runs at finer resolution for shorter ranges. This is the most respected operational ensemble in the world. The quality of ECMWF forecasts—measurably better than any other operational model at medium ranges—is one of the better-known facts in meteorology, but not widely known to general audiences.
The practical implication is that “30% chance of rain tomorrow” is an ensemble-derived probability, not a simple deterministic statement. A 30% precipitation probability from a well-calibrated model means it genuinely rained in approximately 30% of the ensemble members. This is useful information—but it’s also different from “we have low confidence it will rain” or “we have high confidence it won’t rain,” both of which can produce similar probability numbers with different underlying uncertainty structures.
What Consumer Apps Actually Show (and Don’t Show)
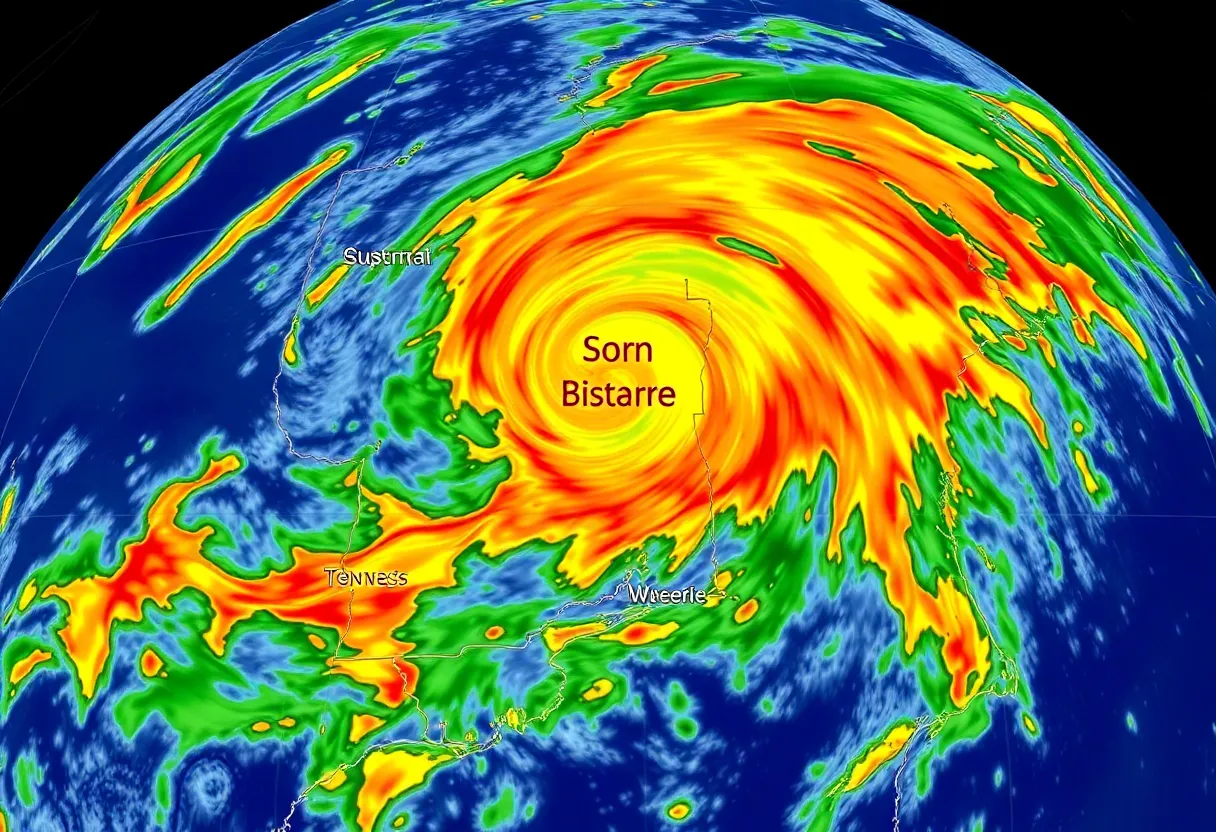
Consumer weather apps—Weather.com, the iPhone Weather app, Dark Sky (now Apple Weather), AccuWeather—do not show you the raw model output or ensemble spread. They show a curated, post-processed presentation that:
Strips probabilistic uncertainty. Instead of showing that tomorrow has a bimodal probability distribution—40% chance of nothing, 40% chance of 5mm rain, 20% chance of 30mm rain—the app shows a single number and a single icon. The information about uncertainty is lost.
Uses proprietary post-processing. The major consumer weather services apply their own statistical post-processing and “value-added” adjustments on top of raw model output. These adjustments are often calibrated to avoid forecast busts (a forecast that says it won’t rain when it does is worse for customer perception than a forecast that says it will rain when it doesn’t) and to match local historical patterns. The result is forecasts that are tuned for user satisfaction metrics rather than pure accuracy.
Presents false confidence. A single temperature value and a single rain probability convey more confidence than the underlying model data justifies. The icon language of “Sunny” or “Thunderstorms” flattens continuous probability distributions into discrete categories that don’t reflect the genuine forecast situation.
Prioritises local precision over medium-range accuracy. Many consumer services put significant emphasis on hyperlocal forecasting (street-level precision) at short ranges, which is impressive when it works but can mislead about the genuine limitations of short-range prediction for convective precipitation (thunderstorms), which is chaotic and inherently unpredictable at hyperlocal scales beyond an hour or so.
How to Actually Access Better Forecast Data
The better forecast data is available—some of it freely, some behind paywalls or requiring technical setup.
Windy.com. Windy is the most accessible route to professional-grade model visualisation for non-specialists. It provides interactive visualisation of multiple model outputs (ECMWF, GFS, and others) including ensemble members, wind fields, precipitation, and model comparison. It’s free for basic use and provides substantially more information than any consumer weather app. The ensemble spread view—showing the range of ensemble member outputs—gives a direct visual read on forecast confidence.
ECMWF open data. ECMWF has progressively opened access to forecast data. Their charts and ensemble products are available through the ECMWF website. The ensemble plumes (showing all 51 members as individual lines) for temperature, precipitation, and wind provide a clear view of forecast confidence at any location at no cost.
Weather prediction forums and community sites. Meteorology communities—Weather Underground’s weather station network, the UK Met Office Community, and specialist forums for severe weather enthusiasts—provide both raw model data access and expert interpretation of model output that consumer apps don’t offer. Following a good meteorologist on social media in your region provides context and uncertainty communication that no app does.
Model comparison tools. Tools like Pivotal Weather (US-focused, subscription) and other professional met tools allow direct comparison of multiple model runs and ensemble spreads. These are used by professional forecasters and are accessible to engaged amateurs.
Why Consumer Apps Are Designed This Way
The design choice to simplify and strip uncertainty from weather forecasts isn’t arbitrary—it reflects rational decisions about what general consumers want and what engagement patterns reward.
User research consistently shows that most consumers want confident, actionable forecasts, not probabilistic information. “Bring an umbrella” outperforms “40% precipitation probability with high uncertainty” in satisfaction metrics, even when the latter is more accurate. Applications optimised for engagement and satisfaction will tend toward overconfident, simple presentations.
There’s also a legitimate argument that raw model data, without post-processing and interpretation, isn’t directly usable by most people. The ensemble spread gives you uncertainty information, but interpreting it requires knowledge of what the models are good and bad at, regional climatological context, and understanding of ensemble spread versus reliability. Professional forecasters spend years learning to extract good predictions from model output. The consumer app’s post-processed confident forecast is, in some sense, pre-applied expertise.
The problem is when that pre-applied expertise is applied optimistically—when the commercial incentive to avoid forecast busts produces systematic overconfidence that misleads users about genuine uncertainty. High-stakes decisions (whether to evacuate before a storm, whether to plan an outdoor event, whether to make travel plans during uncertain weather) benefit from knowing uncertainty, not from having it hidden behind a confident icon.
The Practical Skill
Developing a better intuition for weather forecasts is less about finding a single perfect app and more about understanding when to trust a forecast and when to look deeper.
Short-range forecasts (0–48 hours) from well-calibrated consumer apps are generally reliable. The deterministic models are accurate at this range and post-processing adds value. At this range, the consumer presentation is reasonable.
Medium-range forecasts (3–7 days) are where ensemble spread and model agreement matter. When multiple models and multiple ensemble runs agree, forecasts can be trusted with reasonable confidence. When models disagree substantially—easy to see on Windy.com—treat the forecast as genuinely uncertain and don’t make decisions that depend on the specific outcome.
Extended forecasts (8–15 days) should be treated as probabilistic climate guidance rather than specific predictions. The confidence interval at this range is wide, and single-number forecasts presented with any confidence are misrepresenting the underlying model information.
Understanding this timeline and checking model agreement for medium-range decisions takes five minutes on Windy and produces substantially better-informed decisions than relying on a single consumer app’s confident icon.