LibreNMS vs Zabbix for Monitoring Home Network Switches and Access Points over SNMP

Grace Lin
October 17, 2026
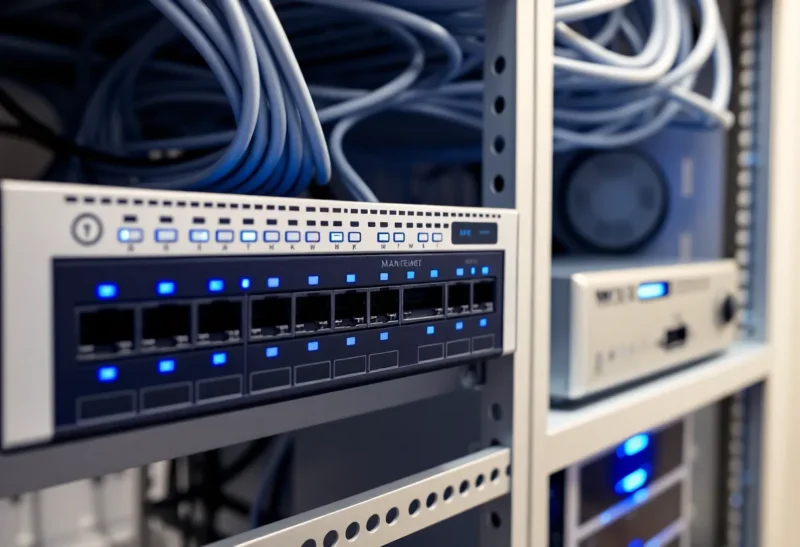
Server monitoring gets most of the attention in homelab guides, but once you own a managed switch, a couple of access points and maybe a firewall, the network itself becomes something worth watching. Which port is the NAS saturating? Why did the upstairs access point drop clients at nine every evening? Is the switch uplink full during backups? Those answers live in SNMP, the old but universal protocol that network devices use to report their counters.
Two open-source tools are the usual suspects for SNMP monitoring at home: LibreNMS, which was built specifically for network devices, and Zabbix, a general-purpose monitoring platform with strong SNMP support. I run a small house network with a managed switch, three access points converted to wired OpenWrt units, and a firewall, and have pointed both at it. They reach similar answers in very different ways.
A network tool and a general monitoring platform
LibreNMS is a network monitoring system that discovers devices automatically over SNMP, LLDP and CDP, identifies what they are, and starts graphing interfaces, traffic, errors, CPU, memory, temperatures and wireless clients without being told what to look for. It supports thousands of device types out of the box, draws network maps from neighbour information, and has a straightforward alerting system. It is a PHP application with a MariaDB database and RRD files for graphs.
Zabbix is a full monitoring platform for servers, applications, networks and services. It monitors network devices through SNMP templates, discovers interfaces and sensors with low-level discovery rules, and evaluates triggers that can be as simple or complex as you like. It also has its own agents for servers, web checks, and integrations with many services. The server stores data in PostgreSQL or MySQL.
| LibreNMS | Zabbix | |
|---|---|---|
| Focus | Network devices | Everything: servers, apps, network |
| Adding a switch | Enter an IP and SNMP details; discovery does the rest | Add a host, link an SNMP template |
| Device support | Thousands of devices recognised automatically | Templates for common vendors; generic SNMP for others |
| Default polling | Every five minutes | Per item, often one minute |
| Network maps | Automatic from LLDP and CDP | Manual maps, with some automation |
| Alerting | Rule builder with sensible defaults | Powerful triggers, dependencies and escalations |
| Learning curve | Gentle | Steeper |
Getting SNMP working on home gear
Before either tool can help, your devices need SNMP turned on. This is often the hardest step at home. Managed switches from most vendors support SNMP in their web interface. UniFi devices enable SNMP through the controller’s settings, and TP-Link Omada devices through their controller or standalone interface; the trade-offs between those two ecosystems are covered in UniFi vs TP-Link Omada. OpenWrt devices need the SNMP daemon package installed. Firewalls such as OPNsense and pfSense offer it as a service or plugin. Many consumer mesh kits and ISP routers do not offer SNMP at all.
A quick test saves a lot of confusion: from the monitoring server, run snmpwalk against the device with your credentials. If it returns a long list of values, both tools will work. If it times out, check the device’s SNMP settings, any access list that restricts which addresses may query it, and firewall rules between VLANs.
Use SNMPv3 with authentication and encryption where devices support it, or at least a non-default community string with SNMPv2c, restricted to your monitoring server’s address. SNMP is read-only for monitoring purposes, but it still reveals a lot about your network.
The first hour with each
LibreNMS’s first hour is satisfying. Install it with the official Docker setup or a virtual machine image, add your switch by IP address and SNMP credentials, and within one or two polling cycles you have a device page with every port graphed, traffic in and out, errors and discards, the switch’s CPU and temperature, and a list of neighbours. Add the access points and firewall the same way, and the network map draws itself from the neighbour data.
Zabbix’s first hour is more about learning the model: hosts, interfaces, templates, items, triggers and discovery rules. Add a host with an SNMP interface, link the right template for your vendor, or the generic SNMP template, and Zabbix discovers interfaces and starts collecting. The result is solid, but you will spend more time in configuration screens, and for less common devices you may need to find or adjust a community template.

Graphs and day-to-day questions
LibreNMS answers network questions fast. Every port has a traffic graph, so “what saturated the uplink last night?” is a couple of clicks. Wireless controllers and many access points report client counts and radio statistics, so you can see the evening drop-off on one access point at a glance. It also tracks port changes, devices going up and down, and ARP and MAC tables, which helps answer “which port is that device on?”
Its default five-minute polling smooths out short spikes. For a home network, that is usually fine for trends but can hide brief saturation. You can shorten the interval, with more load on the server and some care with graph settings.
Zabbix collects at whatever interval you set per item, commonly one minute, and keeps raw history plus trends. Its graphs and dashboards are flexible, and you can combine network and server metrics on one screen, for example NAS disk activity next to the switch port it is connected to. That combination is where Zabbix shines for people who also monitor servers. A broader comparison of Zabbix with Prometheus for a homelab is in Zabbix vs Prometheus for a homelab.
Alerts worth getting
LibreNMS ships with alert rules you can enable, such as device down, port down, high utilisation, high temperature or a sensor out of range, and a rule builder for your own. Alerts go to email, ntfy, Telegram, Pushover and many other services. It is easy to get useful alerts quickly.
Zabbix’s trigger system is more powerful: dependencies so that a dead switch does not also fire alerts for every device behind it, escalations that notify differently if a problem lasts, maintenance windows and complex conditions. Its templates include many triggers by default, and as with most monitoring platforms, expect to tune some out to avoid noise.
For a home network, the most useful alerts tend to be few: a device unreachable, an uplink or important port down, a port flapping, errors climbing on a cable, and a switch or access point overheating in a cupboard.
Resource use and upkeep
For a home network of a dozen devices, both run comfortably on a small virtual machine or mini PC with a couple of gigabytes of memory. LibreNMS uses a MariaDB database, a web server, PHP workers and RRD files; storage grows with the number of ports. Zabbix runs a server process, a web front end and a database; with one-minute polling on many items, the database grows faster, so set sensible history and trend retention.
Upgrades are routine for both. LibreNMS updates itself daily by default in standard installs, which keeps device support current but means changes arrive without you deciding; you can switch to monthly releases. Zabbix has long-term support releases every year and a half or so, with standard releases in between, which suits people who prefer to upgrade deliberately.
Three home networks and what fits them
A managed switch, a few access points and a firewall, and you mainly want to see traffic and problems. LibreNMS. You will have useful graphs and maps within an hour, with almost no configuration.
A homelab with several servers, containers and services, plus a network. Zabbix, if you want one tool for everything and are willing to invest an afternoon in learning its model. Network and server data in one place, with proper alert dependencies, is worth it.
A large or varied collection of second-hand enterprise network gear. LibreNMS again. Its device recognition covers far more models out of the box, including old switches bought cheaply for home labs.
Small lessons from watching a house network
Whichever tool you choose, a few things become obvious within weeks. Error counters on a single port usually mean a bad cable or connector, not a bad switch, and fixing it often cures mysterious slowness. Access points in cupboards or attics run hot in summer, and temperature graphs make that visible before they start dropping clients. Backups and media server scans are typically the biggest traffic events of the day, which helps schedule them. And devices that disappear briefly every night often have a power-saving feature or a scheduled reboot nobody remembered.
Network monitoring at home is less about dashboards and more about these small discoveries. Once a tool has a few weeks of history, the network stops being a mystery.
Choosing by the job
If the network is what you want to understand, choose LibreNMS. It was built for exactly this job, recognises your devices automatically, draws maps from neighbour data, and gives every port a graph from day one.
If you want one monitoring platform for servers, applications and the network, choose Zabbix. It takes longer to learn, but its flexibility, per-minute data and alert logic make it a strong long-term home for all your monitoring.
Some people run LibreNMS for the network and something lighter for servers, which is also perfectly reasonable. The important part is turning SNMP on and letting history build up.