How Urban Tree Canopy Mapping Is Becoming a Public Health Tool

Hannah Voss
July 9, 2026
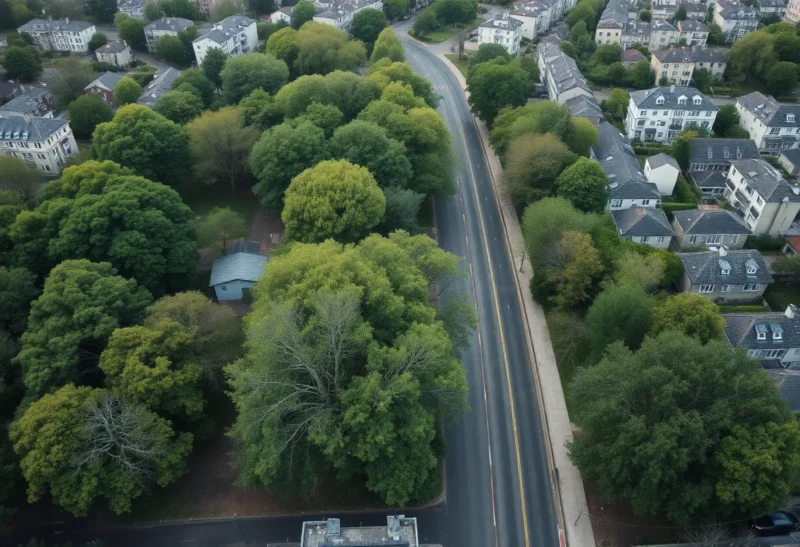
Urban tree canopy — the aggregate coverage of tree leaves and branches viewed from above a city — has moved from a mostly aesthetic and municipal forestry planning metric into something public health researchers and city planners now treat as a genuinely actionable health data layer, comparable in some respects to air quality monitoring or heat vulnerability mapping. That shift has been driven largely by improvements in remote sensing and mapping technology that let researchers measure tree canopy coverage with a precision and granularity that wasn’t practically achievable even a decade ago, combined with an accumulating body of research connecting canopy coverage directly to measurable health outcomes at the neighborhood level.
How Canopy Mapping Technology Actually Improved
Older urban forestry assessment relied heavily on manual surveys, aerial photograph interpretation, and periodic sampling that produced useful but coarse, infrequently updated canopy estimates, generally at a citywide or large-district level of resolution rather than fine-grained enough to distinguish meaningful differences between adjacent neighborhoods with genuinely different canopy conditions. Modern canopy mapping instead relies on high-resolution satellite and aerial imagery combined with LiDAR (laser-based distance measurement that can distinguish tree height and canopy structure, not just simple ground-cover classification) and increasingly automated machine-learning-based image classification that can process this imagery at a scale and speed manual analysis never achieved.
This technical improvement means researchers and planners can now generate canopy coverage maps precise enough to compare individual city blocks or even specific properties, updated on a meaningfully faster cycle than the multi-year gaps typical of older survey methods, which is precisely the resolution and update frequency needed to support the kind of neighborhood-level public health analysis that wasn’t practically feasible with coarser, older assessment approaches.
The Urban Heat Island Connection Is the Clearest, Best-Documented Link
The most well-established and directly measurable public health connection tree canopy mapping supports is urban heat island analysis — the well-documented phenomenon where paved, built-up urban areas with limited vegetation run measurably hotter than surrounding areas with more tree cover and green space, particularly during heat waves, due to reduced evapotranspiration cooling and increased heat absorption and retention by pavement and buildings.
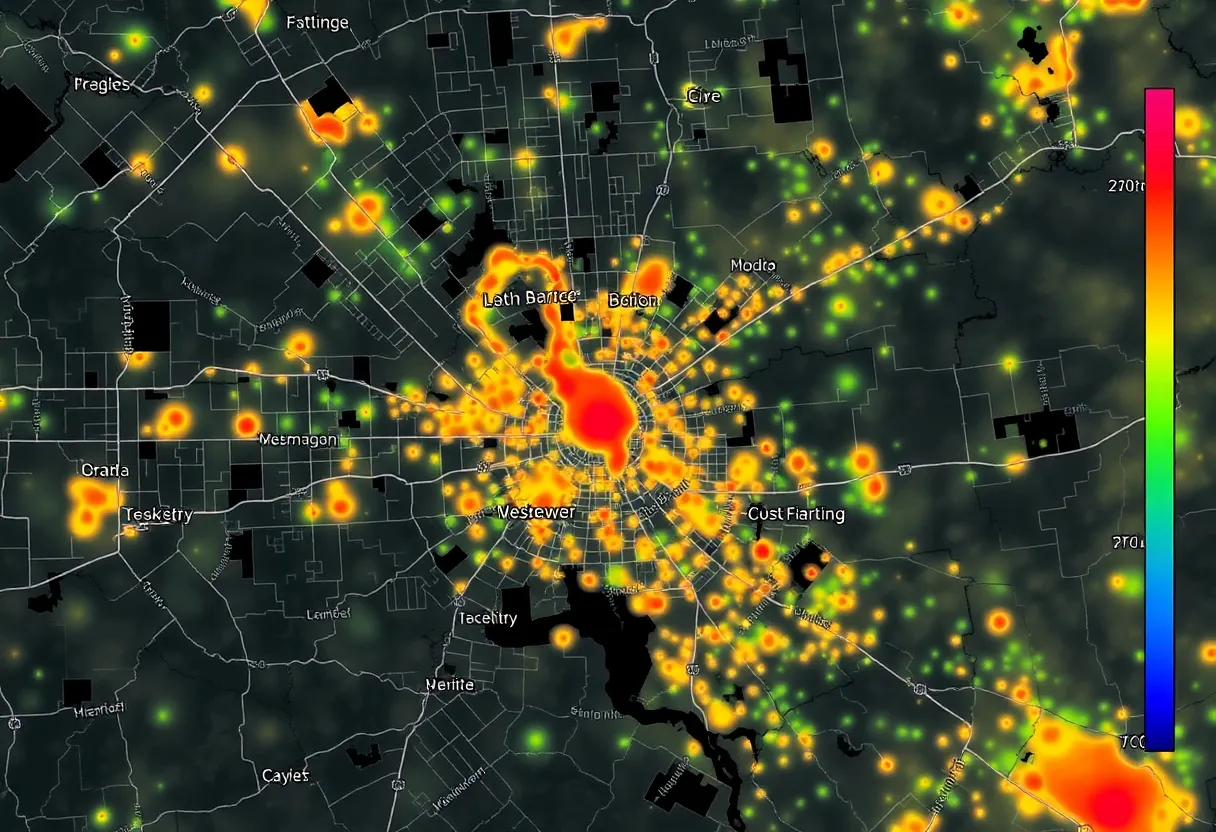
Combining high-resolution canopy mapping with thermal satellite imagery and ground-based temperature sensor networks lets researchers and public health departments identify specific neighborhoods facing the highest heat exposure risk during extreme heat events with a precision that supports genuinely targeted intervention — directing cooling center resources, heat wave outreach, and emergency response planning toward the specific blocks where canopy data and thermal imaging show the most severe heat exposure, rather than applying uniform citywide heat response resources without accounting for how unevenly heat risk is actually distributed across a city’s different neighborhoods.
Canopy Coverage as a Predictor of Broader Health Outcomes
Beyond the direct heat exposure connection, epidemiological research has found associations between neighborhood tree canopy coverage and a range of other health outcomes, including respiratory health (trees filter some air pollutants and reduce particulate exposure), mental health and stress indicators (exposure to green space has documented associations with reduced stress markers and improved reported mental wellbeing), and even some cardiovascular health metrics in observational studies, though researchers are careful to note that many of these broader associations are correlational and involve genuine complexity in disentangling tree canopy’s direct causal contribution from other neighborhood characteristics that tend to correlate with canopy coverage, like income level and housing quality.
This research complexity hasn’t stopped public health departments and urban planners from treating canopy mapping as a genuinely useful health equity indicator regardless of the precise causal mechanisms involved, since canopy coverage disparities so consistently and strongly track with other well-documented health and environmental justice disparities across neighborhoods that canopy data serves as a practically useful proxy and planning tool even where the underlying causal research is still actively being refined.
Why Canopy Distribution Has Become an Environmental Justice Issue
Detailed canopy mapping across US cities has consistently revealed a strong, well-documented pattern: lower-income neighborhoods and communities of color systematically show lower tree canopy coverage than wealthier, whiter neighborhoods within the same city, a disparity with roots tracing back to historical housing policy including redlining and disinvestment patterns that shaped which neighborhoods received public and private investment in street trees and green space over decades.
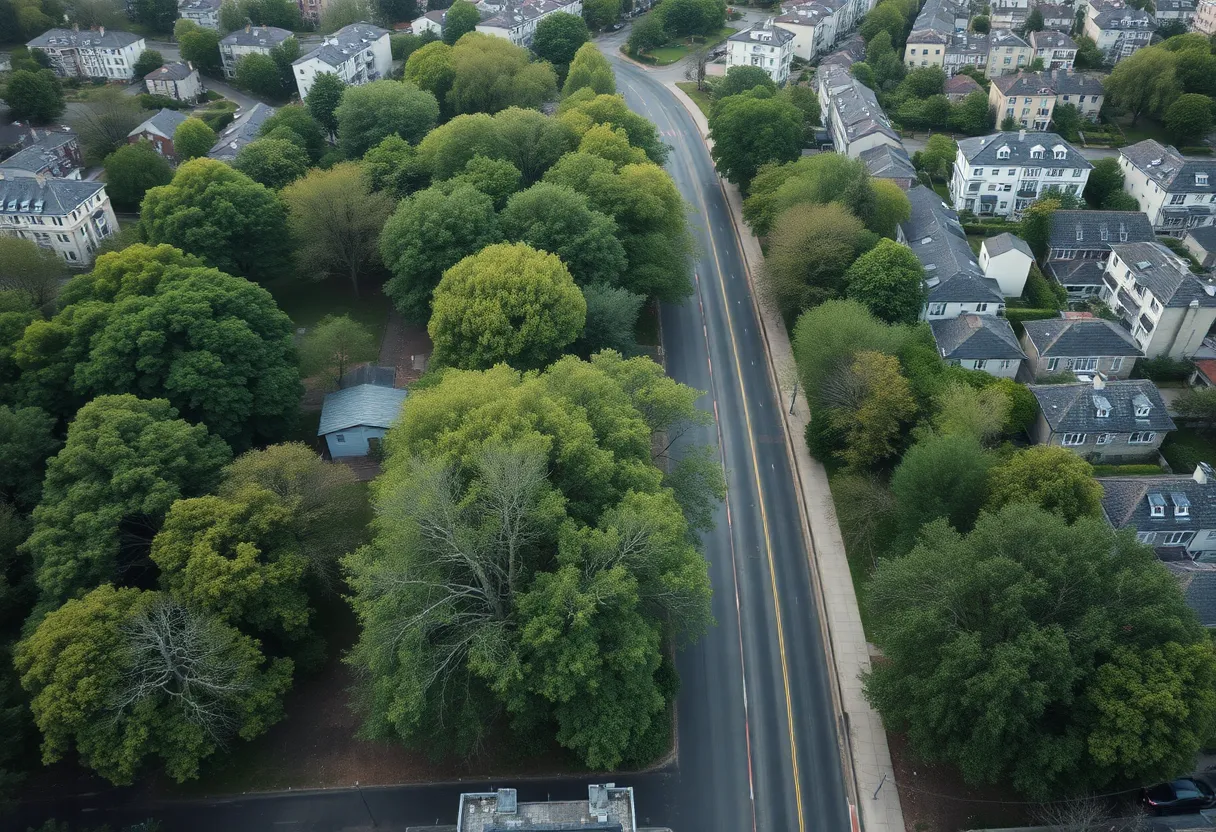
This documented pattern has directly shaped how a growing number of cities now approach tree planting and urban forestry budget allocation, using precise canopy mapping data specifically to identify and prioritize historically underserved, low-canopy neighborhoods for new tree planting investment, treating canopy equity as an explicit public health and environmental justice goal rather than allocating urban forestry resources purely through the more informal, request-driven processes that historically tended to favor neighborhoods with more civic engagement capacity and resources to advocate for tree planting investment.
Why This Represents a Genuine Shift in Urban Planning Practice
The integration of precise canopy mapping into public health and urban planning decision-making reflects a broader shift toward treating urban greenery as measurable health infrastructure rather than simply an aesthetic amenity, comparable in institutional seriousness to how cities treat other environmental health data layers like air quality monitoring. This shift has tangible planning consequences: several major cities have adopted specific canopy coverage targets tied explicitly to public health and equity goals, incorporated canopy data into climate resilience and heat emergency planning, and used granular mapping data to justify and target urban forestry budget allocation in ways that weren’t practically possible with the coarser, less frequently updated canopy assessment methods available even a decade earlier.