How Esports Broadcast Tech Is Borrowing Telemetry Tricks From Formula 1

Futurion Editorial
July 9, 2026
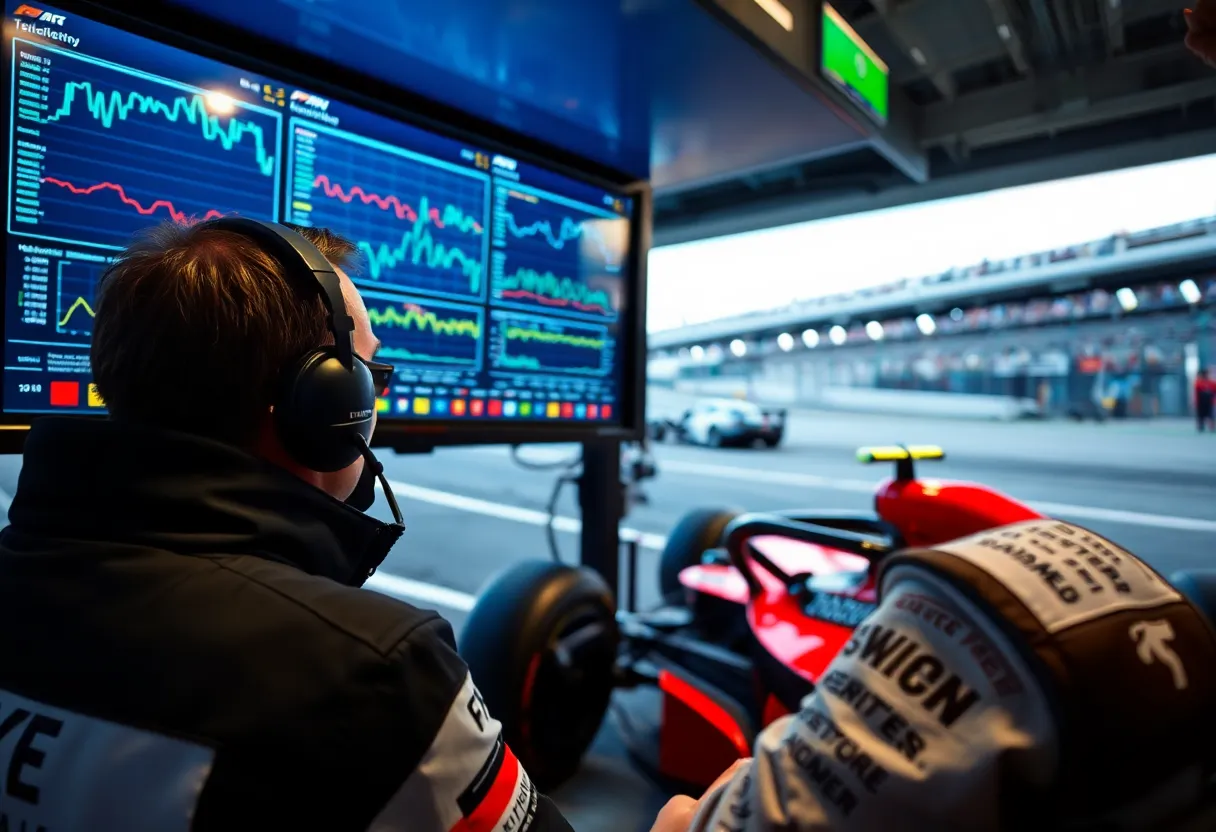
Watch a Formula 1 broadcast for five minutes and you’ll see it: a small graphic showing a driver’s throttle and brake input as a colored trace, a real-time gap-to-leader ticker updating every few tenths of a second, a tire temperature readout glowing progressively redder as a compound wears past its optimal window. That layer of live data transformed how F1 broadcasts communicate the sport, turning an event that can look, to a newcomer, like cars driving in a circle into a legible unfolding drama of strategy and physical limits. Esports broadcast production teams noticed, and over the last several years, a specific set of ideas borrowed directly from motorsport telemetry has been quietly reshaping how competitive gaming gets presented to viewers.
Why F1 Solved This Problem First
Formula 1 has had a three-decade head start on the specific problem esports now faces: how do you make a fast, technical, numbers-driven competition legible to a television audience in real time, without slowing the broadcast down to a stats-recitation crawl. F1 teams have transmitted extensive telemetry — hundreds of data channels covering everything from tire pressure to individual wheel speed — from car to pit wall since the 1990s, originally purely for engineering and strategy purposes. Broadcasters gained access to a curated subset of that same data stream starting in the early 2000s, and the graphics packages built around it, refined over twenty-plus years by companies like the F1 Media and broadcast technology partners, established a visual language: minimal, glanceable, updating fast enough to feel live but simplified enough not to require an engineering degree to parse mid-race.
The specific graphical conventions that emerged — a compact side-by-side driver comparison bar, a track map with live position dots, a braking-and-throttle trace rendered as a simple color-coded line rather than a raw numeric readout — solved a genuinely hard information design problem: how to convey complex, rapidly changing quantitative data to a mass audience watching on a couch, most of whom have no technical background, without either dumbing the sport down or overwhelming casual viewers. Esports production teams, facing an almost identical problem with games that generate equally rich but equally opaque data streams, started studying and adapting these exact conventions rather than reinventing the wheel.
What Games Actually Have to Work With
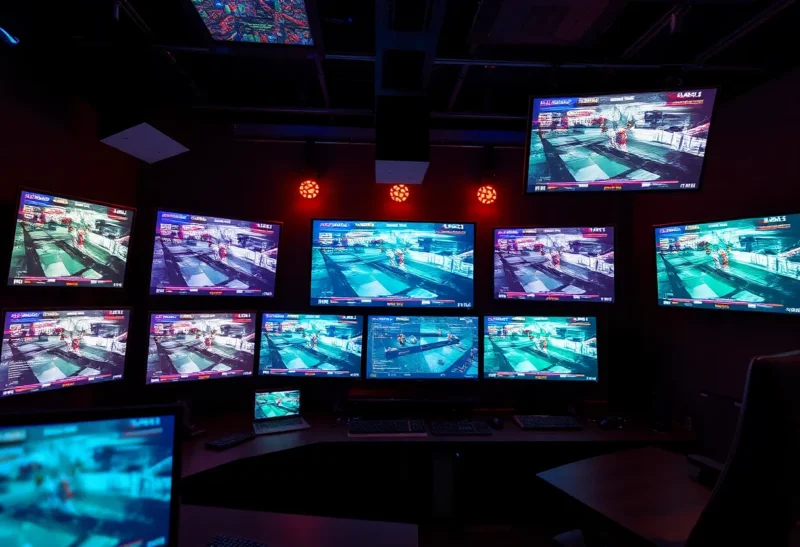
Modern competitive games generate telemetry data that, in raw volume, genuinely rivals what a Formula 1 car produces — player position, aim direction, resource counts, ability cooldowns, damage dealt, economy state, and dozens of other variables updating many times per second, all already computed by the game engine for its own internal logic and therefore technically available to extract for broadcast use. The practical challenge esports production faced was never really data availability; it was building the pipeline and presentation layer to turn that raw internal game-state data into the same kind of glanceable, real-time-legible graphics that motorsport broadcasting had already spent decades refining.
Riot Games’ work on League of Legends broadcast production is probably the most visible and most directly credited example of this cross-pollination. The company has publicly discussed studying traditional sports broadcast graphics, including explicitly citing motorsport and traditional sports data visualization, when redesigning its competitive broadcast overlay system, which now includes live gold-difference tickers, objective timers, and player-comparison panels that function almost identically in visual logic to an F1 gap-to-leader or tire-strategy graphic — different data, same underlying information design principle of compressing a complex, fast-changing number into an instantly readable visual comparison.
Valve’s Dota 2 broadcast tooling and the extensive third-party overlay ecosystem built around games like Counter-Strike have followed a similar trajectory, with community-built and later officially adopted broadcast tools increasingly borrowing the “live trace graph” convention — rendering a continuously updating value, like team net worth difference or round-by-round economy state, as a smoothly animating line graph rather than a static number that jumps discretely, specifically because the animated trace reads as more immediate and alive to a viewer’s eye, exactly the same psychological effect motorsport broadcasts get from an animated throttle trace versus a static percentage figure.
The Harder Problem: Making the Invisible Visible
Motorsport telemetry solves a problem that is, in some respects, easier than the one esports broadcasting faces: a Formula 1 car’s relevant state — speed, position, tire wear — corresponds to physical, intuitively graspable concepts that audiences already understand from driving cars themselves. A significant part of what makes competitive game data hard to broadcast is that much of the meaningful strategic information is abstract in a way lap time or tire wear isn’t — concepts like “vision control,” “map pressure,” or “tempo advantage” in games like League of Legends or Dota 2 don’t have an obvious single number or intuitive physical analog the way a car’s speed does.
This has pushed esports broadcast technology in a direction motorsport never really had to go: building predictive and derived statistics, not just raw telemetry display. Win-probability models, similar in spirit to the win-probability graphics that have become common in traditional sports broadcasting like American football and baseball, now appear in top-tier League of Legends, Dota 2, and Counter-Strike broadcasts, computed by machine learning models trained on historical match data that translate an otherwise abstract, hard-to-read game state into a single, viewer-friendly percentage that updates live throughout a match. This is a genuine step beyond what motorsport broadcast graphics have generally attempted, since F1’s live statistics are almost entirely descriptive (what is currently true) rather than predictive (what is currently likely to happen).
The Production Pipeline Behind the Graphics
Building this kind of live data overlay requires a production pipeline with real engineering complexity behind it, and the structure of that pipeline is another place where the motorsport parallel holds up well. Just as F1 broadcasts pull a curated subset of the car’s full telemetry stream through dedicated broadcast data feeds managed separately from the teams’ own engineering telemetry, esports productions run dedicated “observer” or “broadcast” clients — essentially specialized instances of the game client with elevated information access, granted specifically for broadcast purposes — that extract game state and feed it through a data pipeline to graphics rendering software, typically running on a several-second buffer to allow production teams to catch and correct data glitches before they reach the live broadcast feed.
Latency management is a genuinely underappreciated shared challenge. F1 broadcasts have to reconcile telemetry data, which can have its own transmission delay from the car, with the video feed, ensuring a throttle-trace graphic doesn’t visibly desync from what viewers see the driver’s car actually doing on screen. Esports productions face an equivalent synchronization problem between the extracted game-state data feed and the rendered game video, and getting this wrong produces the same jarring effect in either sport: a statistic or graphic that visibly lags or leads what’s actually happening, breaking the sense that the broadcast is showing you a coherent, trustworthy live picture.
Where the Two Worlds Are Now Diverging Again
Having borrowed heavily from motorsport’s broadcast conventions to solve the initial “how do we show fast technical data live” problem, esports broadcast technology is now pushing into territory motorsport broadcasting hasn’t followed as aggressively, particularly around interactive and personalized data display. Some esports platforms and broadcast apps now let viewers choose which data overlays to display or drill into player-specific statistics on a companion second-screen app during a live broadcast, a level of viewer-controlled data customization that traditional motorsport broadcasting, still built primarily around a single director-controlled broadcast feed distributed through conventional television and streaming, has been slower to adopt at scale.
The cross-pollination, in other words, looks increasingly like a two-way relationship rather than a one-directional borrowing. Esports absorbed decades of hard-won information design lessons from motorsport to solve its initial legibility problem quickly rather than reinventing them from scratch, and is now pushing those ideas further into predictive statistics and viewer-interactive data in ways that traditional motorsport broadcasting, watching from the other side, has started to take note of in return.