Beszel vs Netdata for Monitoring a Few Home Servers: A Light Agent or Per-Second Everything

Ivo Markham
October 16, 2026
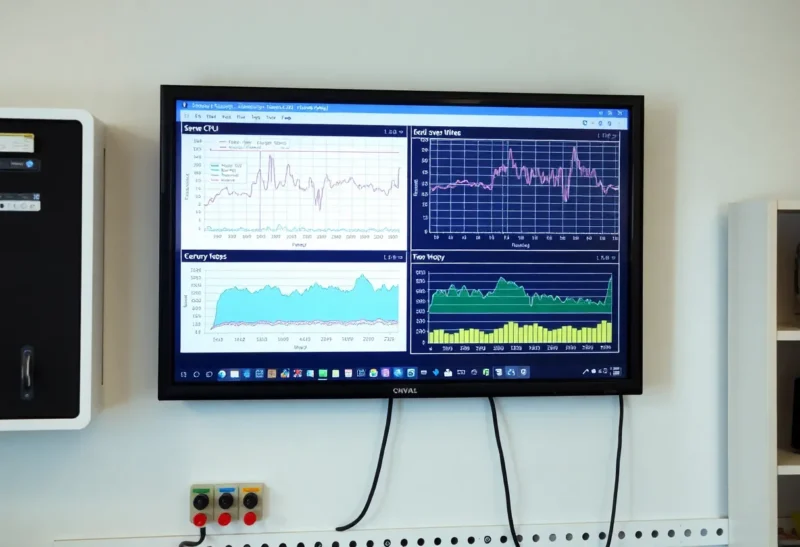
Once a homelab grows beyond one machine, you want a single place to see how everything is doing: CPU, memory, disks, temperatures, network and containers on each box. The heavyweight answer is Prometheus and Grafana, which can do anything but takes real effort to build. For two to five home servers, most people want something that installs in minutes and just shows the graphs.
Beszel and Netdata are two of the most popular answers, and they sit at opposite ends of the “lightweight” scale. Beszel is deliberately minimal: a small hub, tiny agents, and the handful of metrics that matter. Netdata collects everything, every second, with alerts and anomaly detection built in. I run both on a small set of home servers, and here is what each is like to live with.
Small and simple, or everything per second
Beszel is an open-source monitoring hub with lightweight agents. The hub is a small web application that stores history and shows dashboards, and each server runs an agent that reports system metrics: CPU, memory, disk use and I/O, network traffic, temperatures, GPU use where supported, and resource use for each Docker container. That is about it, and that is the point.
Netdata is an open-source monitoring agent that collects thousands of metrics per second from the system and from applications it detects automatically, such as databases, web servers, containers, sensors and network devices. Each agent has its own dashboard, agents can stream to a central “parent” node, and an optional Netdata Cloud service ties multiple nodes together in one view. It ships with hundreds of preconfigured alerts and machine-learning anomaly detection.
| Beszel | Netdata | |
|---|---|---|
| Metrics collected | Core system and Docker container stats | Thousands, system and applications |
| Resolution | Coarser, suited to trends | Per second |
| Agent footprint | Very small | Larger, scales with metrics collected |
| Multi-server view | Built into the hub | Parent node or Netdata Cloud |
| Alerts | Simple thresholds, many notification services | Hundreds preconfigured, plus anomaly detection |
| Setup time | Minutes | Minutes per node; longer to tune |
Installing on three home servers
Beszel setup is quick. Run the hub in a container, log in, click “add system”, and it gives you a command or Docker Compose snippet with a key for the agent. Run that on each server, and within a minute the systems appear in the hub with live and historical graphs. The agents connect over SSH-style key authentication, and the hub can also accept connections from agents behind NAT.
Netdata installs on each machine with a one-line script or a container. The local dashboard is immediately full of charts, often more than you expected, because it finds containers, disks, network interfaces and services automatically. To see all servers together, you either connect them to Netdata Cloud or configure one Netdata as a parent that receives streams from the others. Both work; the parent approach keeps everything on your own hardware.
What each one costs to run
Beszel’s agents are tiny, typically a few tens of megabytes of memory or less and negligible CPU. That makes them suitable for Raspberry Pis, low-power mini PCs and small VPS instances where every megabyte counts. The hub itself is also light.
Netdata uses more, since collecting thousands of metrics every second takes work. A typical agent might use a few hundred megabytes of memory and a few percent of a core on a small machine, more with many containers or applications and with machine learning enabled. Netdata has options to reduce this: lower collection frequency, fewer plugins, shorter retention, or disabling anomaly detection on small nodes. On a Raspberry Pi, those settings matter.
Storage follows the same pattern. Beszel keeps modest history in its database. Netdata stores tiers of data, high-resolution for recent periods and aggregated for longer ones, and you can choose how much disk to give it.
When the graphs actually help
For most homelab questions, such as “why is this box slow?”, “which container is eating memory?” or “is the disk filling up?”, Beszel’s metrics are enough. Its per-container view is particularly useful: you can see at a glance which service uses the most CPU or memory on each server, and how that has changed over weeks.
Netdata shines when you need to understand what happened in a specific minute. Per-second resolution reveals short spikes that averaged graphs hide: a backup saturating disk I/O for thirty seconds, a container restarting repeatedly, a network interface dropping packets. Application-level metrics also help: database queries, web server response codes, or disk latency per device, without configuring anything.
The flip side is noise. Netdata’s dashboard can feel overwhelming when you only want to know whether things are fine. Beszel’s is calm by design.
Alerts that do not cry wolf
Beszel’s alerts are simple: set thresholds for CPU, memory, disk, temperature, bandwidth or a system going offline, per server, and choose how to be notified. It uses a library that supports many notification services, such as email, ntfy, Telegram, Discord and others. You get exactly the alerts you created, so you rarely get surprised.
Netdata ships with hundreds of alerts already configured, covering disk space, memory pressure, network errors, application health and more. That is valuable, since it catches problems you did not think to watch, but out of the box it can also be noisy for a homelab, so expect to silence or tune some. Its anomaly detection flags metrics behaving unusually, useful for spotting problems early but another source of notifications to tune.
Neither should be your only alert path for “the server is down”, since an alert from a dead server cannot be sent. Pair either with an external check. Whether Beszel alone is enough, or still needs an uptime checker next to it, is covered in is Beszel enough on its own.

Three problems, two dashboards
Real incidents show the difference better than feature lists. Here is how each tool handled three problems from my own servers.
A disk filling up slowly. A container’s log grew by a few gigabytes a week. Beszel’s disk graph showed the steady climb over a month, and a threshold alert at 85% fired days before it mattered. Netdata caught it too, with its preconfigured disk-space alert and a prediction of when the disk would be full. Both did the job; Beszel’s single graph was quicker to read.
A nightly slowdown. Every night around 2 a.m., a media server stuttered for a few minutes. Beszel showed a CPU bump at that time but not much more. Netdata’s per-second charts showed disk I/O wait spiking as a backup and a library scan ran at the same moment, with the exact processes involved. Moving the scan by an hour fixed it. This is where per-second data pays off.
A container stuck in a restart loop. Beszel’s container list showed it at once, with memory dropping to zero and climbing again every few seconds. Netdata showed it too, among many other container charts. For quick “which container is misbehaving” questions, Beszel’s container view is the clearer of the two.
The pattern holds generally: Beszel answers “what is wrong” quickly, Netdata answers “why” in more detail.
Where Prometheus and Grafana fit
Both tools sit below a full Prometheus and Grafana stack in flexibility. If you want custom dashboards that combine metrics from many sources, long-term storage, and queries across everything, Prometheus is the standard. Netdata can export its metrics to Prometheus, which makes it a good collector for a stack you might build later. Beszel is more self-contained.
For a single home server, the question of whether a full stack is overkill is covered in Netdata vs Prometheus and Grafana for one home server. For two to five servers, both Beszel and Netdata will usually give you more value per hour of setup than building a stack from scratch.
Privacy and the cloud option
Beszel is entirely self-hosted: the hub and agents run on your hardware, and nothing leaves your network unless you send alerts to external services.
Netdata agents also run locally, and you can keep everything on your own network with a parent node. Netdata Cloud is optional and convenient, offering a combined view, team access and mobile-friendly dashboards. The cloud service’s free tier and its limits have changed over time, so check the current terms if you plan to rely on it. Metrics stay on your agents, with the cloud showing them on request, but it is still an external dependency.
A simple way to decide
Start with what you want to see each day. If you want a calm overview of a few servers, how busy they are, which containers use what, and whether disks are filling up, with a handful of alerts you set yourself, choose Beszel. It is tiny, quick to install, and perfect for low-power hardware.
If you want to diagnose problems in depth, see every metric at one-second resolution, and get a large set of alerts and anomaly detection without writing any yourself, choose Netdata. Give it the resources it needs and spend an hour tuning alerts.
Many people run Beszel as the everyday overview and keep Netdata installed on the one or two servers where they want deep diagnostics. They are light enough together that you do not have to pick just one.