How Modern Noise-Floor Measurements Work in Audio Equipment

Kai Brandt
July 7, 2026
Audio equipment specifications typically include noise floor measurements—expressed in dBFS, dBu, or as signal-to-noise ratios in dB—that are simultaneously among the most important technical specifications for audio quality and among the most frequently misrepresented or misunderstood in marketing materials. Understanding what these numbers actually measure, how they’re obtained, and what they mean for real-world audio quality gives a clearer picture of what separates genuinely excellent audio equipment from gear that simply claims to be excellent.
What Noise Floor Means Physically
All electronic circuits generate some level of noise—random electrical fluctuations produced by thermal agitation of electrons (thermal noise, also called Johnson-Nyquist noise), by quantisation in digital systems, by power supply interference, and by various other mechanisms. The noise floor is the level at which this noise sits relative to the maximum signal the system can carry without distortion.
This relationship is expressed as dynamic range: the ratio of the maximum undistorted signal level to the noise floor level. An audio interface with 120 dB of dynamic range can produce a signal 120 dB louder than its noise floor. In practice, this means that very quiet signals—the quiet breath between sung phrases, the room ambience of a concert recording—can be captured with the noise floor sitting well below the level where it would be audible.
The human auditory system has a dynamic range of approximately 120–130 dB from the threshold of hearing to the threshold of pain. This provides context for evaluating equipment dynamic range specs: 120 dB of dynamic range in audio equipment theoretically covers the full range of what human hearing can perceive, though in practice other factors limit usable dynamic range.
How Noise Floor is Measured
Noise floor measurements in audio equipment follow standardised test protocols, but the specific conditions under which measurements are taken significantly affect the results—and manufacturers sometimes choose measurement conditions that produce more impressive numbers than typical operating conditions would.
The basic approach: the device under test is connected to a calibrated measurement system, the input is either left open or terminated with a resistive load (depending on the type of device), and the output signal is measured with no intentional input signal applied. The measured noise level relative to the device’s maximum output level determines the dynamic range.
A-weighting vs unweighted measurements. Noise measurements are often expressed with A-weighting (indicated by “A” in the spec, e.g., “120 dBA”), which applies a frequency-response curve to the noise measurement that de-emphasises frequencies where human hearing is less sensitive. A-weighted noise measurements typically produce numbers that are 5–15 dB better than unweighted measurements on the same equipment, because low-frequency noise (hum, rumble) and very high-frequency noise are discounted.
A-weighting is defensible—it produces numbers that correlate better with perceived noise audibility than unweighted measurements—but it should be understood when comparing specifications. An unweighted noise floor of -100 dBu and an A-weighted noise floor of -112 dBA on different pieces of equipment may represent similar actual performance, or the A-weighted measurement may be masking worse low-frequency noise.
Bandwidth. Noise measurements are taken over a specific frequency bandwidth, typically 20 Hz to 20 kHz (audio bandwidth) or sometimes narrower. Because noise power increases with bandwidth, measurements taken over narrower bandwidths report lower noise levels. Some specifications don’t state the measurement bandwidth.
Input termination. Measuring a preamp with its input terminated (a resistor connected across the input to simulate a source impedance) produces different results than measuring it with the input open or with a specific microphone connected. The input termination affects the noise contribution of the input stage.
THD+N and Its Relationship to Noise
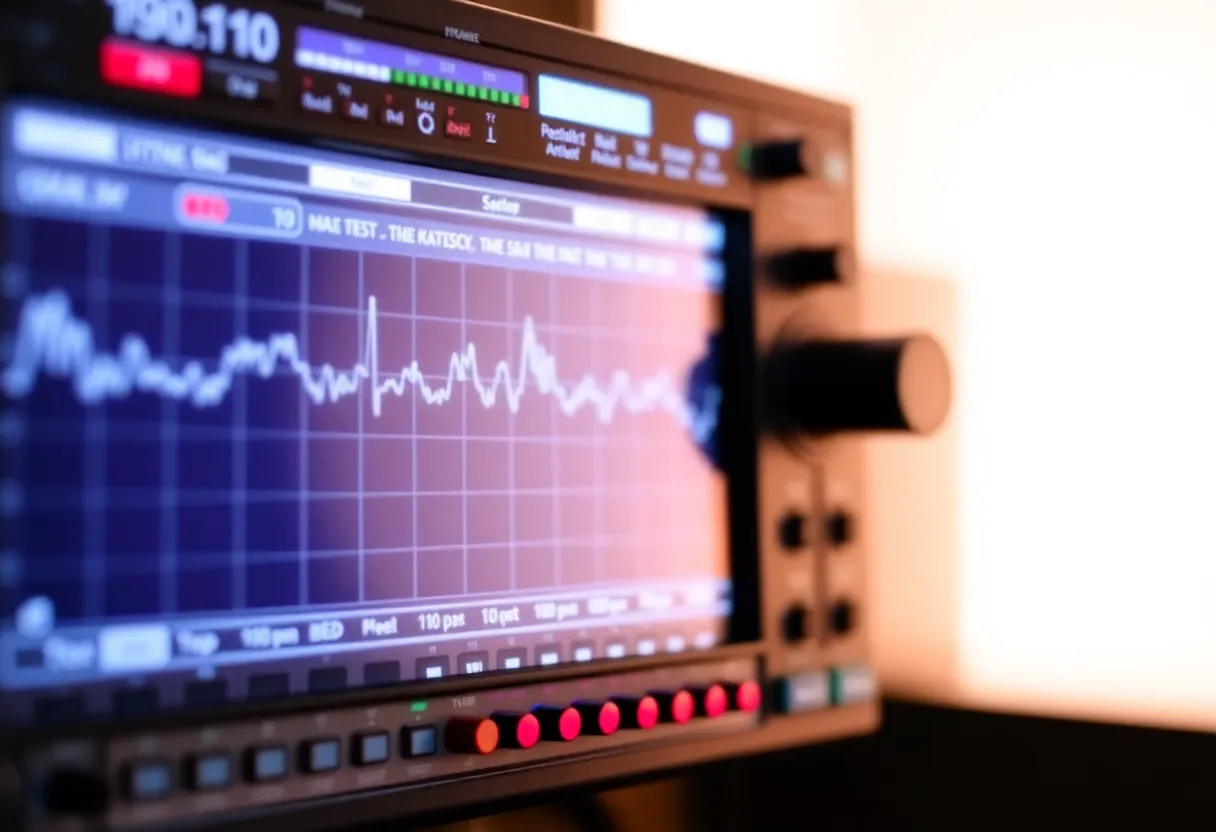
A closely related measurement is THD+N (Total Harmonic Distortion plus Noise), which measures all unwanted signal components—both harmonic distortion products and noise—relative to the fundamental signal. THD+N is often a more useful metric than noise floor alone because it captures both distortion and noise in a single number that reflects overall signal fidelity.
At low signal levels, THD+N is dominated by noise (because the signal is small relative to the noise floor). At high signal levels, THD+N is dominated by distortion (because the circuit is being driven harder). Well-designed audio equipment shows a characteristic U-shaped THD+N curve: worst at very low levels (noise-dominated), best in the mid-range, then rising again at near-clipping levels (distortion-dominated).
The “best THD+N” figure in a specification—which manufacturers often highlight—represents the optimal operating point of this curve, not the typical operating condition. Understanding that the THD+N curve exists and that performance varies with signal level is important for evaluating audio equipment specifications accurately.
Digital Audio: Quantisation Noise and Dither
In digital audio systems, noise floor is partly determined by the bit depth of the digital representation. Each bit of resolution adds approximately 6 dB of dynamic range, so a 16-bit system has a theoretical dynamic range of 96 dB and a 24-bit system has 144 dB. These numbers represent the ratio of maximum signal to the quantisation noise—the error introduced by rounding continuous analog values to discrete digital values.
Dither is added to digital audio during conversion to manage quantisation noise. Rather than allowing quantisation to produce structured distortion artifacts (which are particularly audible at low signal levels), dither randomises the quantisation error. This spreads the error energy as noise across the frequency spectrum rather than concentrating it as correlated harmonics. The perceptual result of well-dithered audio is that quiet signals fade into genuine noise rather than audible distortion artifacts.
The noise floor of a digital audio interface or converter includes contributions from both its analog circuitry (the ADC’s input stage, reference voltage, etc.) and the quantisation noise of the conversion process. High-quality 24-bit converters are typically limited by their analog circuitry rather than quantisation—achieving 120–130 dB of dynamic range rather than the theoretical 144 dB, because the analog front end introduces noise above the quantisation floor.
Self-Noise in Microphone Preamps
Microphone preamplifiers present a particularly important noise floor context because the level of signal from a microphone is very low—often in the microvolt range for quiet sources at distance—and must be amplified by 40–70 dB to reach line level. Any noise in the preamp’s input stage is amplified along with the signal.
Preamp self-noise is specified as the equivalent input noise (EIN)—the level of noise that, if present at the input, would produce the observed output noise. EIN is typically expressed in dBu (referenced to 0.775V RMS). Lower EIN means a quieter preamp. A modern high-quality preamp might have an EIN of -130 dBu or better; budget preamps might be -120 dBu.
The practical significance depends on the microphone and application. Recording a loud electric guitar cabinet, the preamp’s self-noise is completely irrelevant—the signal is far above any noise the preamp produces. Recording a very quiet acoustic source with a low-sensitivity ribbon microphone at distance, the preamp’s EIN directly determines the noise floor of the recording.
Reading Specifications Without Being Misled
The key questions to ask when evaluating audio equipment noise specifications:
Is the measurement A-weighted or unweighted? A-weighted is more common and legitimate but produces better-looking numbers. Knowing which one allows valid comparison.
What bandwidth was used? Full audio bandwidth (20 Hz–20 kHz) is standard. Narrower bandwidths inflate the number.
What input condition was used? “Input terminated” (or “input shorted” for some preamplifiers) is the standard condition; open-input measurements can produce different results.
Is this measured or calculated? Some manufacturer specifications are theoretical calculations based on component specs rather than measurements of production units. Independent measurements from reviewers using calibrated equipment—publications like Audio Science Review, Stereophile’s measurements section, and SoundOnSound’s lab reports—provide the most reliable third-party verification of what equipment actually achieves in practice.
Understanding these details allows meaningful comparison across equipment at different price points and helps distinguish genuine technical advances from marketing-driven specification inflation. Modern audio equipment—even at moderate price points—has achieved noise floor performance that was considered remarkable in professional contexts not long ago; knowing how to read the specs properly reveals where the genuine quality improvements exist.