What Makes a City Bus Network Actually Work Well: Lessons From Systems That Do

Ola Mensah
July 7, 2026
Most cities have bus networks. Very few have bus networks that work well. The gap between a city where buses are a last resort used only by those with no alternatives and a city where buses are a genuinely useful transport option for a broad range of people is not primarily a question of money—it’s a question of design decisions, political will, and understanding what drives ridership.
The research on bus network design has converged on several findings that are well-established in the transport planning literature but inconsistently applied in practice. Cities that have successfully transformed their bus networks—Houston’s 2015 redesign, Jarrett Walker’s consultation projects in Auckland, Columbus, and elsewhere, Helsinki’s long-running frequency investments—provide case studies in what actually moves the needle on transit usefulness.
Frequency Is the Foundation
The single most important variable in whether a bus network is useful is frequency—how often buses run. This seems obvious until you examine how much of transit investment goes into things other than frequency improvement.
The practical reason frequency dominates is that it determines how much of a user’s time transit consumes. A bus that runs every 10 minutes requires almost no schedule management—you walk to the stop and a bus comes. A bus that runs every 30 minutes requires planning your entire trip around the schedule, adds potential wait time of up to 30 minutes per transfer, and means a single missed bus can add 30 minutes to a journey. The difference between 10-minute and 30-minute frequency is not a 20-minute inconvenience—it’s the difference between a service that’s usable for spontaneous trips and one that requires significant planning overhead for every journey.
Jarrett Walker’s concept of the “freedom threshold” captures this: below approximately 10-12 minute headways, a service provides genuine spontaneous usability. Above 15-20 minutes, the service requires schedule dependence that dramatically reduces its utility for people who have the option of using alternatives. Most urban bus networks run at frequencies well above the freedom threshold for most of the day and most of their routes.
The reason more networks don’t achieve high frequency is resource allocation: it costs roughly the same to run a route at 10-minute frequency as at 30-minute frequency (the vehicles and drivers cost the same per hour regardless of how full the buses are). Running at 10-minute frequency on all routes simultaneously requires more vehicles and drivers than most transit agencies have. The necessary trade-off is concentrating frequency on routes that serve the most people.
Grid Networks vs Radial Networks
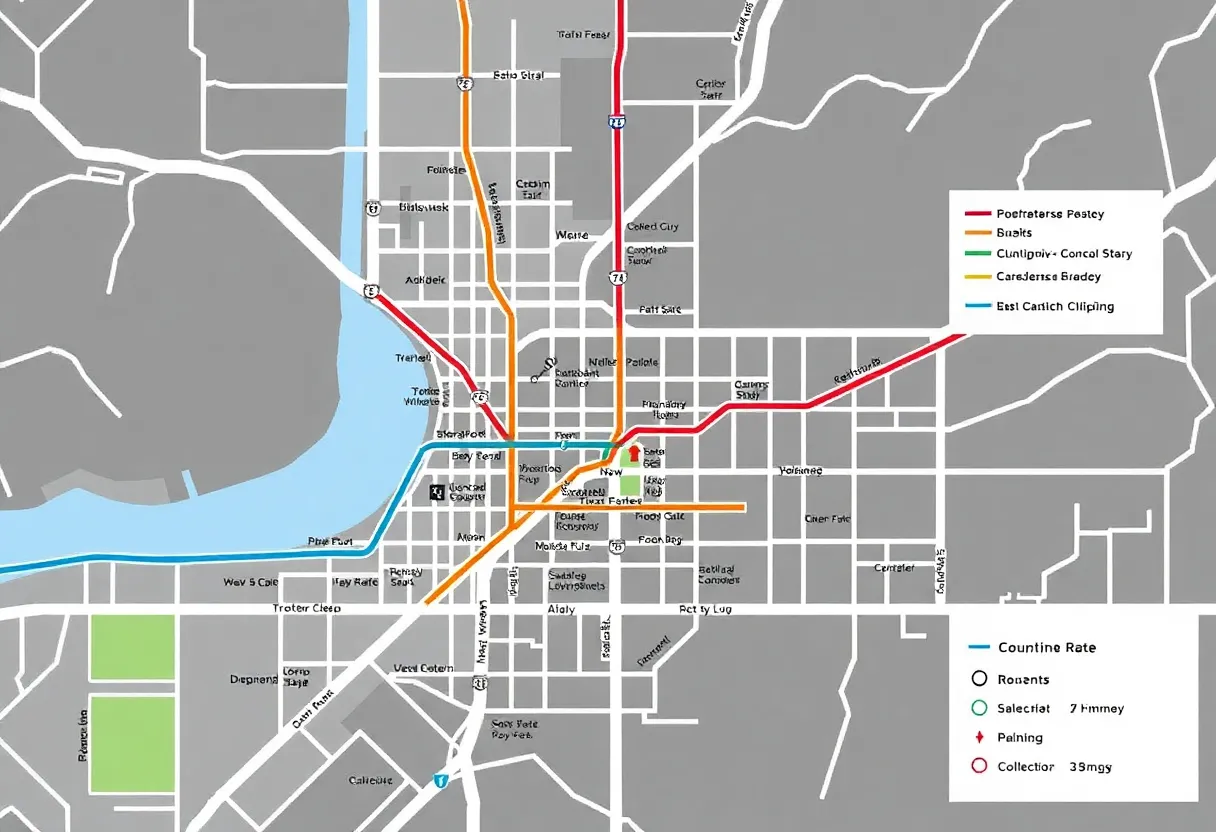
Most bus networks are designed as radial systems: routes converge on a city centre, carrying people from the periphery toward downtown. This design made sense historically when employment and retail were concentrated in city centres. It works poorly for the modern city, where travel patterns are more dispersed.
A grid network—a pattern of roughly parallel routes running horizontally and vertically across a city—enables one-transfer connections between almost any two points in the covered area. It concentrates service on a smaller number of high-frequency corridors rather than distributing it thinly across many low-frequency routes. The trade-off is that trips that don’t follow the grid require a transfer, which adds inconvenience if the connecting service isn’t frequent enough.
Houston’s 2015 network redesign, executed under Walker’s consultation, is the best-documented case study in modern grid redesign. The existing network was radial, with many low-frequency routes. The redesign reduced the number of routes and concentrated service to achieve higher frequency on a grid of corridors. Ridership on the redesigned network grew, particularly among choice riders—people who had other transport options but chose transit because it had become faster and more predictable.
The political challenge of grid redesigns is that they require eliminating or reducing low-frequency coverage routes that serve specific communities. These communities understandably resist service reductions, even when the overall network improvement would benefit more people. Transit agencies navigating these changes must engage communities early and address the equity concerns directly—often by maintaining coverage routes at a base level while concentrating frequency improvements on the highest-demand corridors.
Stop Spacing and Its Impact on Speed
Bus stops placed too close together produce slow buses. Each stop adds boarding and alighting time, and acceleration/deceleration cycles consume significant time in total over a route. Many urban bus networks have inherited stop spacings of 200–250 metres or less—a legacy of historical placement decisions when buses competed with walking distances—that produce average speeds well below what the vehicle could achieve.
Research on stop spacing consistently finds that 400 metres (roughly every two blocks) is near optimal for most urban environments: close enough that almost all users can reach a stop within a 2-3 minute walk, but far enough to allow reasonable speeds between stops. Reducing stop counts can improve average speeds by 15–20% on routes with very dense stop placement, with modest impact on average walking distance.
Stop elimination is another politically contentious intervention: every stop removed represents a concrete loss for users who used that stop, while the speed improvement is distributed and incremental. Transit agencies that have successfully reduced stop counts have typically done so with community engagement, providing explicit walking-distance analysis for affected stops.
Bus Rapid Transit (BRT) takes this principle further by combining widely-spaced stops with dedicated lanes, pre-paid boarding (fare payment off-vehicle), and level boarding (no step at the door). High-quality BRT systems—Bogotá’s TransMilenio, Curitiba’s original BRT system, several Asian implementations—achieve average speeds approaching light rail and at substantially lower capital cost. Lower-quality BRT (dedicated lanes without level boarding, or bus lanes that don’t receive enforcement) produces modest improvements.
Priority Infrastructure: Making Buses Faster
Buses share streets with private cars in most cities. When streets are congested, buses are congested too—which means they run slowly, unreliably, and expensively (slow buses require more vehicles to maintain a given frequency). The relationship between bus network reliability and dedicated infrastructure is direct.
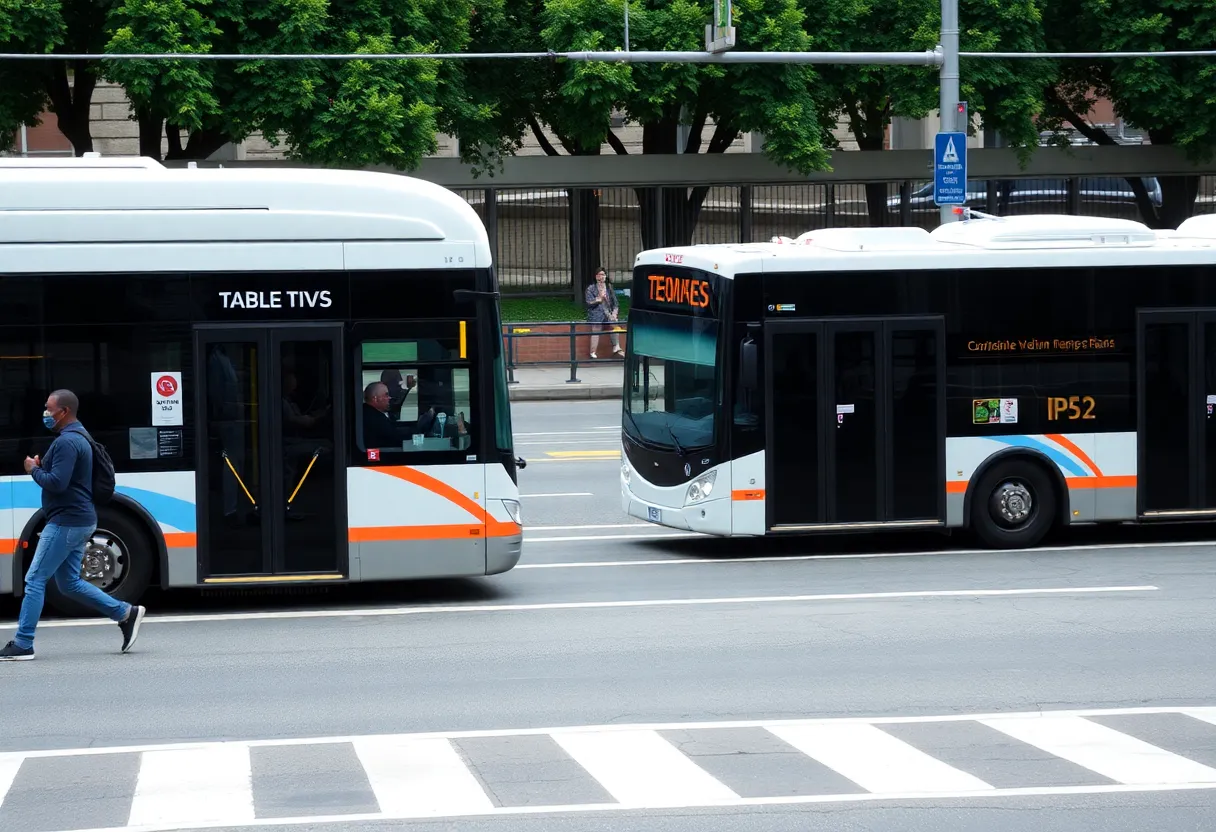
Bus lanes—dedicated kerb-side or central lanes reserved for buses—improve both speed and reliability. Reserved signal phases at intersections (bus signal priority or TSP—Transit Signal Priority) that extend or create green phases for approaching buses reduce average intersection delay. Queue-bypass lanes at congested intersections allow buses to pass queuing traffic.
These interventions are politically difficult because they reallocate road space from private vehicles to buses. The political economy is challenging: each car lane removed has a visible cost (drivers who must find alternative routes or times), while the benefit is distributed across bus users and future users who will choose transit because it became faster. Cities that have successfully expanded bus priority have typically built constituencies among transit users and framed the change as a broader transport efficiency improvement rather than a transit-vs-cars conflict.
Real-Time Information and Its Limits
Real-time departure information—screens at stops, smartphone apps—has become a standard expectation for modern transit. The evidence on its ridership impact is more modest than transit agencies often imply.
Real-time information reduces perceived wait time more than actual wait time: knowing the bus is three minutes away feels better than waiting without information, even if the actual wait is the same. For services running at high frequency, real-time information matters less—you don’t need to know when the next bus comes if it’s every 7 minutes. For infrequent services, real-time information reduces anxiety but doesn’t change the fundamental problem of infrequent service.
Real-time information is valuable and worth providing, but it’s a service quality improvement, not a ridership-growth strategy. The networks that have grown ridership have done so through frequency and speed improvements, not through information technology alone.
What Cities with Good Bus Networks Have in Common
Helsinki, Zurich, Singapore, Tokyo, Curitiba, and several others have bus networks that function as genuine transport options for broad populations. The common factors are not primarily wealth or density (though both help): they’re sustained political commitment to transit investment, willingness to allocate road space to transit, and network design that prioritises frequency and directness over coverage extension.
The contrast with lower-performing networks is largely political. The transport policies that produce good bus networks—bus lanes that reduce car capacity, frequency investments that require difficult resource allocation, stop reductions that remove service from some communities—all have visible losers and diffuse winners. Building political support for these changes requires sustained advocacy, clear communication about trade-offs, and leadership willing to take short-term political risk for long-term transport improvement.
The technical knowledge of what makes bus networks work is not scarce—the literature is extensive and the successful case studies are well-documented. The gap between knowing and implementing is political, institutional, and organisational. Cities that have closed that gap have generally done so through specific periods of leadership that prioritised transit improvement and were willing to make the contentious decisions that good bus network design requires.