Why Bike Lane Design Quality Varies So Much Between Cities That Claim to Prioritize It

Remy Torres
July 9, 2026
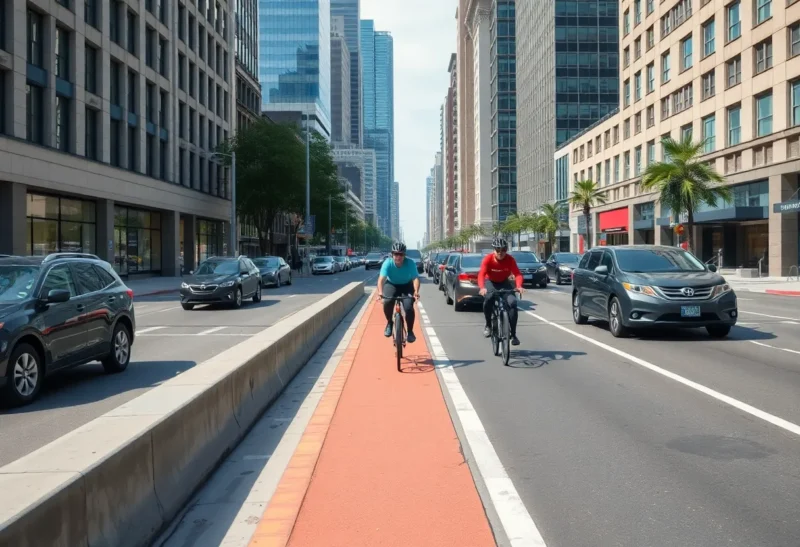
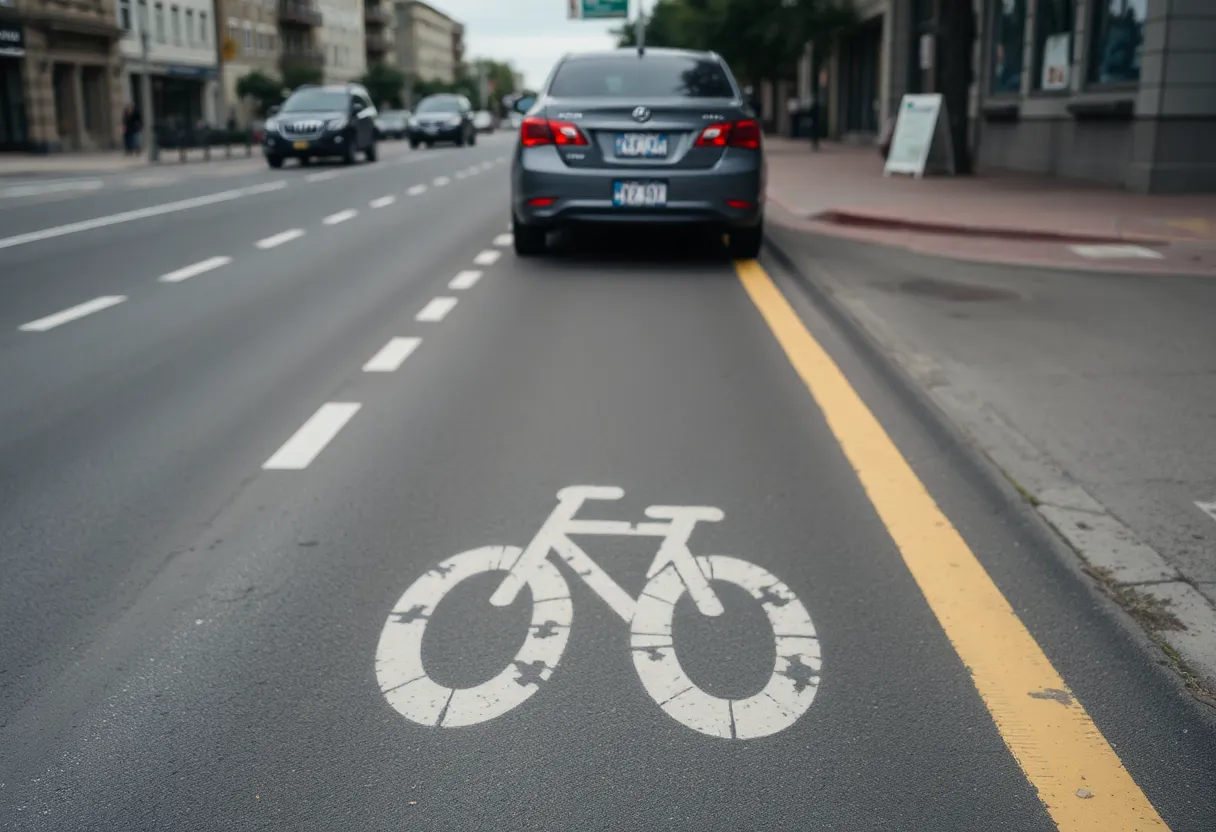
Two cities can both claim, in press releases and planning documents, that they’re building out serious cycling infrastructure, and produce results that aren’t remotely comparable in practice. One ends up with a network of physically separated lanes that a nervous beginner would feel safe using. The other ends up with painted lines on the pavement that disappear the moment a car needs to park, turn, or double-park for a delivery — technically counted as “bike lane miles” in the same official statistics, functionally almost useless as protection. The gap between those two outcomes isn’t really about how much a city cares about cycling. It’s about a specific set of engineering, funding, and governance decisions that determine whether “bike lane” means a real facility or a line of paint.
Painted Lanes Were Never Designed to Be the End State
Standard painted bike lanes — a single stripe separating a narrow lane from car traffic, with no physical barrier — are the cheapest and fastest infrastructure a city can deploy, which is exactly why they dominate early-stage cycling networks in nearly every city that starts building one. They’re also the infrastructure type with the weakest safety record among common bike lane designs, because a painted line provides zero physical protection against a vehicle drifting, double-parking, or making a turn without checking the lane. Research from transportation safety studies consistently ranks physically protected bike lanes — with a curb, planters, parked-car buffer, or bollards separating cyclists from moving traffic — as substantially safer than paint-only lanes across comparable traffic volumes and speeds.
The gap between cities isn’t usually about whether officials know this. It’s about which cities have moved past the cheap first phase into the more expensive, more politically contested second phase of actually retrofitting painted lanes with physical protection, and which cities have stalled at the painted-lane stage for years while still counting those miles toward cycling infrastructure targets.
The Curb Space Fight Is the Real Bottleneck
Physically protected bike lanes require taking space away from something else — usually on-street parking or a general traffic lane — and that’s where projects that look identical on paper diverge wildly in practice. A protected bike lane redesign that removes parking spots along a commercial corridor routinely triggers organized opposition from adjacent business owners who believe (often incorrectly, according to multiple before-and-after retail revenue studies) that parking removal will hurt foot traffic and sales. That opposition, channeled through local business associations, community board reviews, and city council votes, has killed or watered down a large share of planned protected bike lane projects in cities across North America and Europe, regardless of how strong the original design was.
Cities that have successfully built dense protected networks — Paris’s rapid post-2020 buildout under mayor Anne Hidalgo, or several Dutch and Danish cities operating from a much longer institutional tradition of cycling infrastructure investment — share a specific trait that weaker performers usually lack: a governance structure that can push a network-level plan through parking and curb-space fights systematically, rather than re-litigating the same political fight block by block, project by project, with every individual segment vulnerable to being watered down or canceled independently based on local pressure.
Network Connectivity Matters More Than Total Mileage
A city can report an impressive total mileage of bike lanes while still having a network that’s nearly useless for actual trips, if those miles are scattered, disconnected segments rather than a continuous route someone could actually ride from home to work or school. This is one of the most consistent findings across urban cycling research: a broken network with gaps — where a protected lane simply ends at a difficult intersection and dumps cyclists back into mixed traffic — provides most of the political credit of building bike infrastructure with only a fraction of the actual safety and ridership benefit, because the most dangerous point in most utility cycling trips is the transition points, not the protected midblock segments.
Cities with genuinely effective networks generally planned connectivity as the primary design goal from the start, prioritizing a smaller number of complete, connected corridors over a larger number of disconnected showcase segments — a strategic choice that’s harder to sell politically in the short term, because it means some neighborhoods get nothing in early phases while a specific through-route gets built out completely, rather than every district getting a symbolic bike lane segment simultaneously.
Intersection Design Is Where Most Real Injuries Happen
Even well-protected midblock bike lane segments routinely lose their protection right at intersections, which is precisely where the majority of car-bike collisions actually occur, because turning vehicles crossing a bike lane’s path is a more common collision mechanism than a vehicle drifting into a straight lane segment. Higher-quality designs address this directly with features like protected intersections (a Dutch-originated design using corner islands and setback crossings to keep cyclists visible and physically separated through the turn), leading bike intervals on traffic signals that give cyclists a few seconds’ head start before parallel car traffic gets a green light, and bend-out bike lane routing that keeps a physical buffer present all the way to the intersection rather than dropping it early.
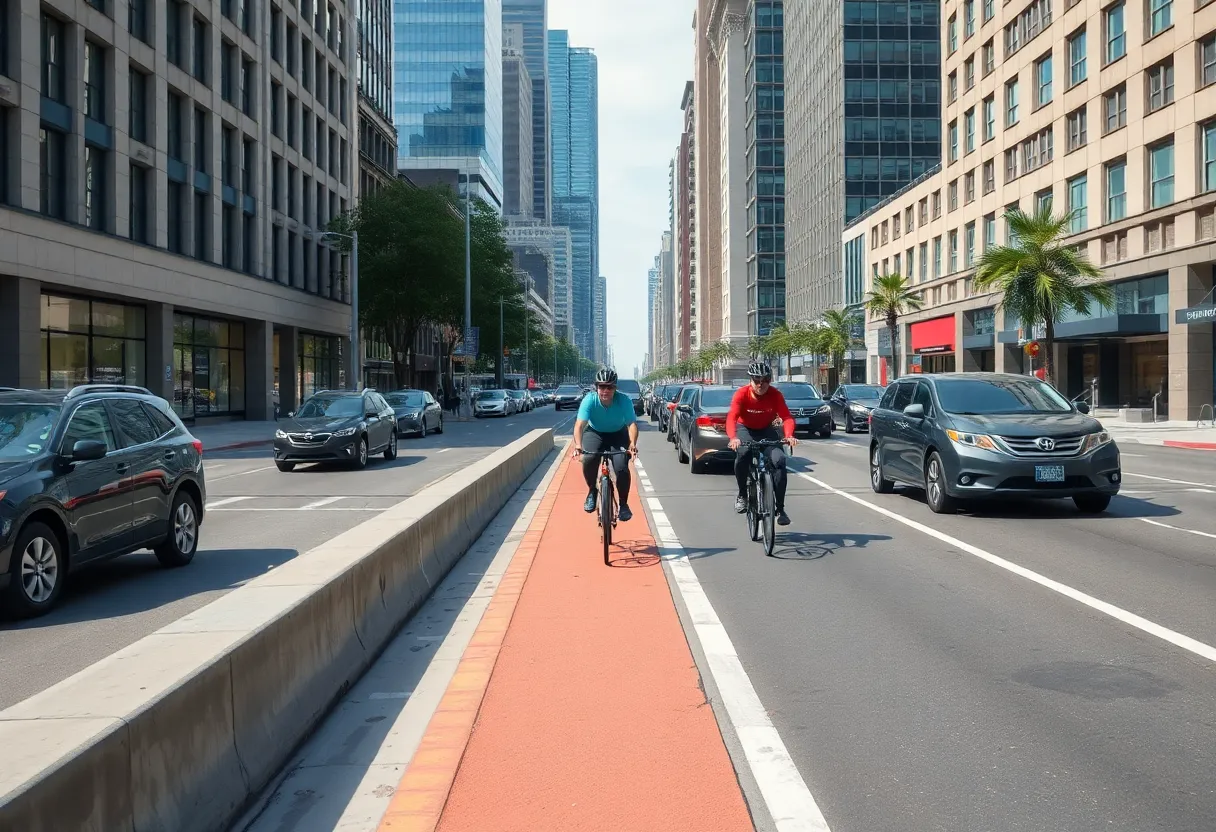
These intersection treatments cost more per installation than a simple painted crossing marking, and they’re frequently the first thing cut from a project budget when costs run over, which means two cities’ bike networks can look similarly protected on a map while having dramatically different real-world safety records once you account for what actually happens at every single intersection along the route rather than just the midblock segments that photograph well in press coverage.
What Separates the Cities That Actually Deliver
Looking across cities that have built genuinely effective cycling networks versus those that have mostly built symbolic ones, the pattern isn’t really about budget size or even overall political commitment measured in speeches and targets. It’s about whether a city has insulated network-level planning decisions from block-by-block political renegotiation, prioritized connected corridors over scattered mileage, and funded intersection treatment as a required part of every segment rather than an optional add-on cut when budgets tighten. None of that shows up in a simple “miles of bike lane built” statistic, which is exactly why that statistic remains such a poor predictor of whether a given city’s cycling infrastructure is actually safe and usable, regardless of how prominently it features in that city’s own official messaging.