What the Stack Overflow Developer Survey Actually Reveals About the Industry

Riley Chen
July 7, 2026
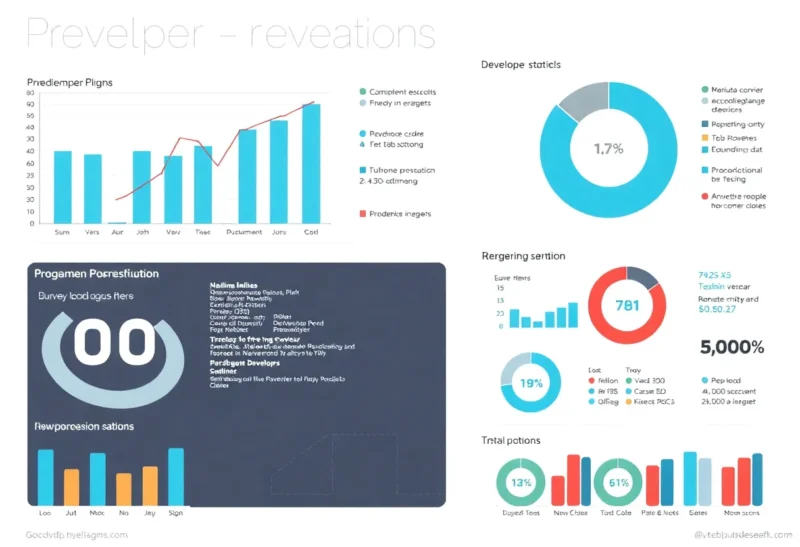
The Stack Overflow Developer Survey, conducted annually since 2011, is the closest thing the software development industry has to a consistent, large-scale census. Tens of thousands of developers worldwide respond each year, reporting on the languages and tools they use, their employment situations, salaries, job satisfaction, and attitudes toward emerging technologies. It’s not a perfect document—self-selection bias is real, certain demographics are overrepresented, and survey design choices affect responses—but it’s one of the few longitudinal datasets capturing the developer industry with enough consistency to track genuine trends.
Reading the raw survey data carefully, rather than just the headline findings, often reveals things that don’t make it into press coverage. The numbers about AI adoption, remote work, developer satisfaction, and language popularity tell a more nuanced story than the typical summaries suggest. Here’s what the data from recent surveys actually shows and what the patterns mean.
AI Tools: Adoption Is Real, But the Split Is Revealing
The 2024 and 2025 surveys both showed that a majority of developers were using AI-powered coding tools—GitHub Copilot, ChatGPT for code assistance, Cursor, and similar tools. By the 2025 survey, over 60% of respondents reported using AI tools in their development workflow.
What got less attention was the breakdown of sentiment. A significant minority of those users described their experience as “unsatisfied” or described the tools as providing marginal rather than transformational value. The enthusiastic users clustered in specific segments: developers working in well-supported languages like Python and JavaScript reported much higher satisfaction with AI coding assistants than developers working in older enterprise languages, specialized domains, or less common stacks where training data coverage is thinner.
The survey also distinguished between using AI tools and trusting AI tools. Most developers who used AI coding assistants reported reviewing and often modifying the generated code before using it. Only a small minority reported using AI output directly without review. This behavioral pattern—widespread use with persistent skepticism—doesn’t fit neatly into either the “AI will replace developers” or “AI is useless” narratives that dominate public discussion.

Remote Work: The Compromise Has Settled
The 2021 survey caught the peak of full remote work enthusiasm, when a majority of developers who had shifted to remote work during the pandemic reported strongly preferring it and wanting to continue. By 2023 and 2024, the picture had evolved. The share of fully remote developers had declined as return-to-office policies took effect. But the share preferring hybrid arrangements had grown substantially.
The most consistent finding across multiple years: developers who were forced back to full in-office arrangements reported significantly lower job satisfaction than those who retained remote or hybrid options. The relationship between geographic flexibility and satisfaction is one of the most reliable signals in the survey—stronger than the relationship between satisfaction and compensation within a wide range, particularly for experienced developers.
Interesting nuance: satisfaction with remote work was not uniform across career levels. Junior developers more frequently reported preferring in-person or hybrid arrangements, citing mentorship, learning from proximity, and social connection as factors. Senior developers more frequently preferred full remote. This seniority gradient maps to different career-stage needs: junior developers often gain more from informal observation and osmosis in a shared workspace than from formal instruction, while senior developers often have the context and self-direction to work productively in isolation.
Language Popularity: What “Most Used” vs. “Most Loved” Actually Means
JavaScript has held the top spot for “most used language” in the Stack Overflow survey for over a decade. The persistence of this finding is less a statement about JavaScript’s technical merits than a structural fact about web development: JavaScript is the only language that runs natively in all major web browsers, making it unavoidable for frontend development. Since virtually every software organization that touches the web has frontend developers, JavaScript’s dominance in survey responses reflects the distribution of developer roles, not developer preference.
The more interesting signals come from admired/desired categories. Python has remained extremely high on both—desired by developers who don’t currently use it, admired by those who do. Rust has been at or near the top of the “most admired” category for multiple consecutive years, a striking finding for a language that ranks outside the top ten in usage. This sustained enthusiasm from a small but passionate user base reflects genuine satisfaction with Rust’s design—its memory safety guarantees and performance have attracted a loyal following, even though the learning curve has kept adoption limited.
TypeScript’s trajectory tells its own story. A relatively minor language in early surveys, it has grown steadily in usage and consistently ranks high in admired categories—a pattern consistent with developers adopting it from JavaScript and finding it genuinely improves their experience. The growth of TypeScript is one of the clearer stories in the historical survey data.
Compensation: What the Numbers Don’t Capture
The salary data in the Stack Overflow survey is widely cited but requires careful interpretation. The most important caveat: the survey asks about compensation in local currency and then presents it in USD, without purchasing power adjustment. A developer in Switzerland earning 150,000 CHF and a developer in Romania earning 70,000 RON (~$16,000 USD) are working in completely different economic contexts, but the raw USD comparison positions them very differently.
The survey’s geographic breakdown shows enormous salary variation—US developers reporting median compensation multiple times higher than developers in Eastern Europe, Southeast Asia, or Latin America. Some of this reflects genuine differences in compensation; a significant portion reflects differences in local cost of living that the survey doesn’t account for.
What the data does reliably show: years of experience correlates strongly with compensation up to about 10–15 years, after which the correlation weakens. Specialization matters—developers in cloud and infrastructure roles, security, and data/ML roles consistently report higher compensation than general web developers. Company size also matters, but not uniformly: very large companies and a subset of high-growth startups report the highest compensation, while small companies generally report lower compensation, with exceptions in markets where they compete aggressively for talent.
Job Satisfaction: What Developers Actually Care About
The survey has consistently asked about factors that contribute to job satisfaction, and the ranking of factors has been relatively stable across years in ways that often surprise people who focus on compensation. The factors that consistently rank highest are not pay-related: they’re about the quality of work itself—interesting technical problems, learning opportunities, and a sense of impact.
Working with up-to-date technology and having opportunities to learn new things rank above compensation in satisfaction importance in most years. This doesn’t mean developers don’t care about pay—they do, and compensation below market rate is a strong driver of job seeking—but it suggests that developer satisfaction in the upper range of reasonable compensation is more about the work than the paycheck.
Management quality—or rather, bad management—is a consistent frustration driver. Developers who report having managers who advocate for them technically and shield them from organizational friction report significantly higher satisfaction than those who don’t. The organizational dynamics around developer autonomy and technical decision-making authority show up repeatedly in satisfaction data.
Demographics: The Survey’s Persistent Blind Spot
The survey’s respondent population is not representative of the global developer workforce. It’s heavily weighted toward English-speaking markets, skewed toward developers who already use Stack Overflow regularly (a self-selected group), and underrepresents women and non-binary developers relative to their actual presence in the industry—though the underrepresentation has decreased over survey history as Stack Overflow has worked to reach more diverse populations.
The gender compensation gap in the survey data has been consistently reported but also consistently complicated: when controlling for experience level, role type, and location, the raw gap narrows significantly. Whether the residual gap reflects bias in the same roles, or whether structural factors lead women into lower-paying specializations within software development, is a question the survey data can flag but not resolve.
The age distribution of respondents clusters heavily in the 25–35 range, underrepresenting both early-career developers (who may not yet be Stack Overflow-heavy users) and developers over 45. The latter group’s underrepresentation in the survey is interesting given ongoing industry concern about ageism—developers in that age group may be less visible in a survey centered on a platform used heavily by people still actively searching for solutions to common problems.
The Value of Longitudinal Data
The survey’s most underappreciated value is its longitudinal consistency. Because the same questions recur across years, you can track how developer attitudes toward technologies, work arrangements, and AI have evolved—not just where they are at any given moment. The multi-year pattern of Rust admiration without corresponding adoption growth, for example, is a more interesting story than any single year’s data. The trajectory of TypeScript adoption from niche to mainstream, visible across several years of data, is a genuinely informative trend.
Reading the annual headline findings as isolated data points misses this context. The Stack Overflow survey, accumulated across more than a decade, is a portrait of how an industry changes—where the changes are driven by genuine improvements in tooling, where they reflect shifts in what companies are hiring for, and where the self-selection of survey respondents amplifies certain voices at the expense of others.
The industry it portrays is one where developers are broadly competent, often satisfied with the technical work, frequently frustrated with organizational constraints, increasingly adopting AI tools with persistent skepticism, and distributed across geographies and work arrangements in patterns that continue to evolve. That picture is more complex than any summary can convey—and more accurate than most of the commentary the survey generates each year.